Annotations
Annotations are used to highlight notable points or areas on the chart. Annotations can also be used to place arbitrary elements such as images, shapes and text onto the chart. The FlexChart control supports various built-in annotations such as Rectangle, Square, Circle, Ellipse, Line, Polygon, Image, and Text.
The annotations may be attached to specific data points or to arbitrary points in data or page coordinates and have common properties as shown in the following table:
| Annotation Properties | Description |
|---|---|
| Attachment | Sets the attachment of annotation. For more details, see Annotation Attachments section. |
| Content | Sets the annotation's textual content. |
| Position | Sets the position of the annotation using AnnotationPosition enumeration. |
| Location | Sets the location of the annotation. |
| Point | Sets the coordinate point of the annotation for DataCoordinate and Absolute attachment techniques. |
| PointIndex | Sets the data point index of the annotation. Applies only when the attachment property is set to DataIndex. |
| SeriesIndex | Sets the data series index of the annotation. Applies only when the attachment property is set to DataIndex. |
| ContentStyle | Sets the style of the annotation's content. |
| Style | Sets the style properties that specifies styling attributes. |
| TooltipText | Sets the tooltip of the annotation. |
Annotation Attachments
FlexChart annotations support the following attachment techniques. To specify the annotation attachment in FlexChart, you can use the Attachment property and set it to any of the following values using the AnnotationAttachment enumeration.
- DataIndex: Coordinates of the annotation point are defined by the data series index and the data point index.
- DataCoordinate: Annotation point is specified in data coordinates.
- Relative: Annotation point is specified as a relative position inside the control where (0,0) is the top left corner and (1,1) is the bottom right corner.
- Absolute: The annotation point is specified in control's pixel coordinates.
Add Annotations
To add annotations to a FlexChart, follow these steps:
- Create an AnnotationLayer attached to the chart.
- Populate it with annotation objects such as Rectangle, Square, Circle, Ellipse, Line, Polygon, Image, or Text.
- Set Attachment property for each annotation to determine how it is attached to the chart.
- Set additional properties on the annotation, such as PointIndex and SeriesIndex if the annotation is attached to a point.
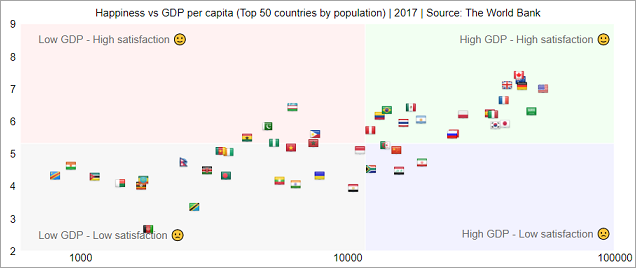
The following code demonstrates how to add annotations to a FlexChart using the above steps. In this example, the annotations are used to display plot quadrants as well as country flags as shown in the image below.

@using C1.Chart;
@using C1.Blazor.Chart;
@using C1.Chart.Annotation;
@using C1.Blazor.Chart.Annotation;
@using System.Drawing;
@using System.IO;
@using System.Reflection;
<FlexChart @ref="chart" Class="chart" ChartType="ChartType.Scatter"
           BindingX="GDP" Binding="Happiness,Population" ItemsSource="Data"
           HeaderContent="Happiness vs GDP per capita (Top 50 countries by population) | 2017 | Source: The World Bank">
    <SeriesCollection>
        <Series />
    </SeriesCollection>
    <AxisCollection>
        <Axis Min="600" Max="100000" AxisType="AxisType.X" LogBase="10" Position="Position.Bottom" AxisLine="false" MajorTickMarks="TickMark.None" />
        <Axis Min="2" Max="9" AxisType="AxisType.Y" Position="Position.Left" AxisLine="false" MajorTickMarks="TickMark.None" />
    </AxisCollection>
</FlexChart>
@code {
        FlexChart chart;
        GdpVsHappiness.CountryData[] Data;
protected override void OnInitialized()
    {
        Data = GdpVsHappiness.GetData();
    }
    protected override void OnAfterRender(bool firstRender)
    {
        base.OnAfterRender(firstRender);
        if (firstRender)
            CreateAnnotations();
    }
    void CreateAnnotations()
    {
        var al = new AnnotationLayer(chart);
        var minx = chart.AxisX.Min;
        var maxx = chart.AxisX.Max;
        var medx = GdpVsHappiness.GdpMedian();
        var miny = chart.AxisY.Min;
        var maxy = chart.AxisY.Max;
        var medy = GdpVsHappiness.HappinessMedian();
        CreateQuadrant(al, 0, "Low GDP - Low satisfaction 🙁", "rgba(100,100,100,0.05)", minx, miny, medx - minx, medy - miny);
        CreateQuadrant(al, 2, "Low GDP - High satisfaction 🙂", "rgba(255,0,0,0.05)", minx, medy, medx - minx, maxy - medy);
        CreateQuadrant(al, 1, "High GDP - Low satisfaction 🙁", "rgba(0,0,255,0.05)", medx, miny, maxx - medx, medy - miny);
        CreateQuadrant(al, 3, "High GDP - High satisfaction 🙂", "rgba(0,255,0,0.05)", medx, medy, maxx - medx, maxy - medy);
        var len = Data.Length;
        for (int i = len - 1; i >= 0; i--)
        {
            var item = Data[i];
            var sz = 16;
            var path = string.Format("https://raw.githubusercontent.com/gosquared/flags/master/flags/flags-iso/shiny/{0}/{1}.png", sz, item.Code);
            var img = new C1.Blazor.Chart.Annotation.Image(path, sz, sz);
            img.Attachment = AnnotationAttachment.DataIndex;
            img.PointIndex = i;
            img.TooltipText = item.Country;
            al.Annotations.Add(img);
        }
    }
    void CreateQuadrant(AnnotationLayer al, int i, string s, string clr, double x, double y, double w, double h)
    {
        var el = new C1.Blazor.Chart.Annotation.Polygon();
        el.Attachment = AnnotationAttachment.DataCoordinate;
        el.Points.Add(new PointF((float)x, (float)y));
        el.Points.Add(new PointF((float)(x + w), (float)y));
        el.Points.Add(new PointF((float)(x + w), (float)(y + h)));
        el.Points.Add(new PointF((float)x, (float)(y + h)));
        el.Style = string.Format("background:{0};color:white;", clr);
        al.Annotations.Add(el);
        var text = new Text(s);
        text.Attachment = AnnotationAttachment.DataCoordinate;
        text.Position = AnnotationPosition.Right;
        switch (i)
        {
            case 0:
                text.Location = new PointF((float)(x + 100), (float)y + 0.5f);
                break;
            case 1:
                text.Position = AnnotationPosition.Left;
                text.Location = new PointF((float)(x + w - 10000), (float)y + 0.5f);
                break;
            case 2:
                text.Location = new PointF((float)(x + 100), (float)(y + h - 0.5));
                break;
            case 3:
                text.Position = AnnotationPosition.Left;
                text.Location = new PointF((float)(x + w - 10000), (float)(y + h - 0.5f));
                break;
        }
        al.Annotations.Add(text);
    }
    public class GdpVsHappiness
    {
        public class CountryData
        {
            public string Country { get; set; }
            public string Code { get; set; }
            public double GDP { get; set; }
            public double Happiness { get; set; }
            public double Population { get; set; }
        }
        static CountryData[] _data;
        static CountryData[] ReadData()
        {
            using (var stream = Assembly.GetExecutingAssembly().GetManifestResourceStream("../Data/GdpVsHappiness.json"))
            {
                using (var sr = new StreamReader(stream))
                {
                    return System.Text.Json.JsonSerializer.Deserialize<CountryData[]>(sr.ReadToEnd());
                }
            }
        }
        public static CountryData[] GetData()
        {
            if (_data == null)
            {
                _data = ReadData();
            }
            return _data;
        }
        public static double GdpMedian()
        {
            return Median(GetData().Select(o => o.GDP));
        }
        public static double HappinessMedian()
        {
            return Median(GetData().Select(o => o.Happiness));
        }
        static double Median(IEnumerable<double> source)
        {
            var data = source.OrderBy(n => n).ToArray();
            if (data.Length % 2 == 0)
                return (data[data.Length / 2 - 1] + data[data.Length / 2]) / 2.0;
            return data[data.Length / 2];
        }
    }
}


