- Blazor Overview
- Get Started with Blazor
- Free and Open Source Software (FOSS) License
- Section 508 Compliance
- Blazor Project Types
- Adding NuGet Packages to your App
- Controls
- Release History
Legend
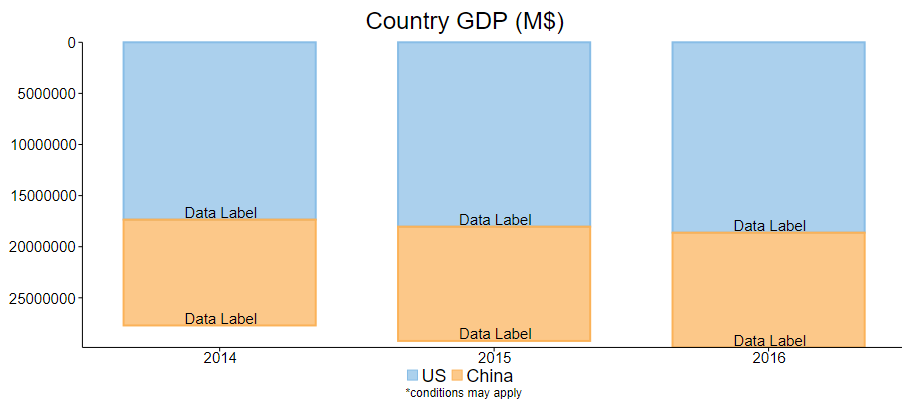
Legend is a chart element which displays a list of colors, symbols and text corresponding to each data series drawn on that chart. It helps in understanding and analyzing the plotted data in the case of multiple series. FlexChart provides the option to display legend for denoting the type of data plotted on the axes. By default, the position of legend is set to Auto, which lets the legend position itself automatically depending on the available space. However, you can also set it to display at top, bottom, left or right with respect to the plot area by setting the LegendPosition property using the Position enumeration. Along with the position, you can also play around with various other properties of the legend, such as LegendToggle and LegendStyle. The LegendToggle property allows you to toggle the series visibility on clicking a legend in the chart and the LegendStyle property is used to style the legend.

The following code example demonstrates how to set various legend properties in the FlexChart. This example uses the sample created in the Quick Start section.
LegendPosition="Position.Bottom" LegendStyle="font-size:18px" LegendToggle="true"
Legend Scrolling
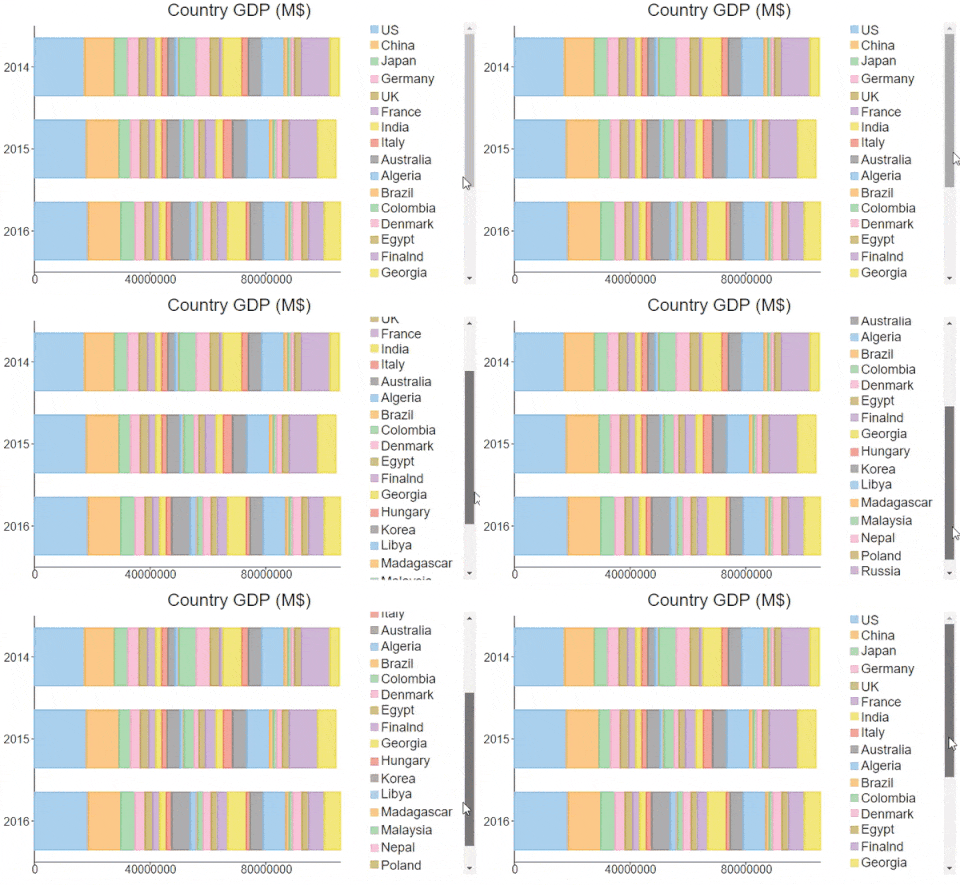
Displaying a large number of legend items in the chart area, at a time, is restricted to the height of the Legend object. This causes the legends to get truncated from the view. FlexChart allows you to add scrollbar in the Legend, so that user can scroll through all the legend items when too many items are displayed in the chart area. It enables scrolling in the legend using the LegendScollbars property, which allows you to display scrollbar using LegendScrollbars enumeration.

The following code demonstrates how to enable scrolling in the legend:
@using C1.Chart;
@using C1.Blazor.Chart;
<FlexChart Class="chart" ChartType="ChartType.Bar" Stacking="Stacking.Stacked"
           HeaderContent="Country GDP (M$)" HeaderStyle="font-size:24px"
           LegendPosition="Position.Right" LegendStyle="font-size:18px"
           LegendScrollbars="LegendScrollBars.Vertical"
           BindingX="year" ItemsSource="@GdpDataSource.GetCountryGdp()">
    <SeriesCollection>
        <Series Name="US" Binding="US" />
        <Series Name="China" Binding="China" />
        <Series Name="Japan" Binding="Japan" />
        <Series Name="Germany" Binding="Germany" />
        <Series Name="UK" Binding="UK" />
        <Series Name="France" Binding="France" />
        <Series Name="India" Binding="India" />
        <Series Name="Italy" Binding="Italy" />
        <Series Name="Australia" Binding="Australia" />
        <Series Name="Algeria" Binding="Algeria" />
        <Series Name="Brazil" Binding="Brazil" />
        <Series Name="Colombia" Binding="Colombia" />
        <Series Name="Denmark" Binding="Denmark" />
        <Series Name="Egypt" Binding="Egypt" />
        <Series Name="Finalnd" Binding="Finalnd" />
        <Series Name="Georgia" Binding="Georgia" />
        <Series Name="Hungary" Binding="Hungary" />
        <Series Name="Korea" Binding="Korea" />
        <Series Name="Libya" Binding="Libya" />
        <Series Name="Madagascar" Binding="Madagascar" />
        <Series Name="Malaysia" Binding="Malaysia" />
        <Series Name="Nepal" Binding="Nepal" />
        <Series Name="Poland" Binding="Poland" />
        <Series Name="Russia" Binding="Russia" />
        <Series Name="Thailand" Binding="Thailand" />
    </SeriesCollection>
    <AxisCollection>
        <Axis AxisType="AxisType.X" Position="Position.Bottom" />
        <Axis AxisType="AxisType.Y" Position="Position.Left" MajorGrid="false" Reversed="true" />
    </AxisCollection>
</FlexChart>
@code {
    public class GdpDataSource
    {
        public static List<object> GetCountryGdp()
        {
            return new List<object> {
                new
                {
                    year = "2014",
                    US = 17348075,
                    China = 10356508,
                    Japan = 4602367,
                    Germany = 3874437,
                    UK = 2950039,
                    France = 2833687,
                    India = 2051228,
                    Italy = 2147744,
                    Australia = 2454654,
                    Algeria = 1245454,
                    Brazil = 218735,
                    Colombia = 5843126,
                    Denmark =4859443,
                    Egypt = 3265981,
                    Finalnd = 1111245,
                    Georgia = 6521451,
                    Hungary = 2316548,
                    Korea = 4541251,
                    Libya = 7845123,
                    Madagascar = 1245365,
                    Malaysia = 1201010,
                    Nepal = 1122121,
                    Poland = 2312121,
                    Russia = 9864523,
                    Thailand = 3216541
                },
                new
                {
                    year = "2015",
                    US = 18036650,
                    China =11181556,
                    Japan = 4124211,
                    Germany = 3365293,
                    UK = 2858482,
                    France = 2420163,
                    India = 2073002,
                    Italy = 1815759,
                    Australia = 4454654,
                    Algeria = 1242454,
                    Brazil = 211035,
                    Colombia = 3543126,
                    Denmark =1559443,
                    Egypt = 2165981,
                    Finalnd = 3711245,
                    Georgia = 2521451,
                    Hungary = 3216548,
                    Korea = 4961251,
                    Libya = 7841123,
                    Madagascar = 1271365,
                    Malaysia = 1201177,
                    Nepal = 1982121,
                    Poland = 2312130,
                    Russia = 9871523,
                    Thailand = 6216541
                },
                new
                {
                    year = "2016",
                    US = 18624450,
                    China = 11232110,
                    Japan = 4936540,
                    Germany = 3479230,
                    UK = 2629190,
                    France = 2466470,
                    India = 2263790,
                    Italy = 1850740,
                    Australia = 6454654,
                    Algeria = 2245454,
                    Brazil = 372735,
                    Colombia = 1843126,
                    Denmark =2759443,
                    Egypt = 2165981,
                    Finalnd = 3411245,
                    Georgia = 6520022,
                    Hungary = 1316548,
                    Korea = 4541280,
                    Libya = 7845190,
                    Madagascar = 1145365,
                    Malaysia = 1207896,
                    Nepal = 3175121,
                    Poland = 2313371,
                    Russia = 5364523,
                    Thailand = 5716541
                }
            };
        }
    }
}


