
-
Spread for ASP.NET 18 Product Documentation
-
Developer's Guide
- Getting Started
- Understanding the Product
- Namespaces Overview
- Working with the Spread Designer
- Customizing User Interaction
- Customizing the Appearance
- Customizing with Cell Types
- Managing Data Binding
- Managing Data in the Component
- Managing Formulas
- Managing File Operations
- Using Sheet Models
- Maintaining State
- Working with the Chart Control
- Using Touch Support with the Component
- Assembly Reference
- Client-Side Scripting Reference
- Import and Export Reference
-
Developer's Guide
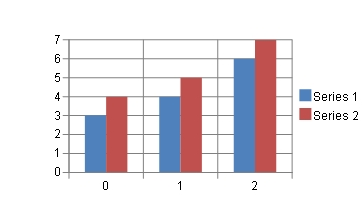
Setting the Chart View Type
You can specify a 2D or 3D view of the Chart control. You can set this with the ChartViewType parameter in the SpreadChart constructor when creating a chart. The following image shows a 2D chart.
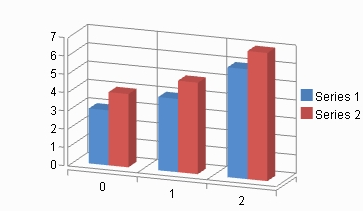
The following image shows a 3D chart.
Using Code
Set the ViewType property.
Example
The following example sets the ViewType property.
FarPoint.Web.Spread.Chart.SpreadChart chart = new FarPoint.Web.Spread.Chart.SpreadChart;
chart.ViewType = FarPoint.Web.Chart.ChartViewType.View2D;
fpSpread1.Sheets[0].Charts.Add(chart);
Dim chart As New FarPoint.Web.Spread.Chart.SpreadChart()
chart.ViewType = FarPoint.Web.Chart.ChartViewType.View2D
FpSpread1.Sheets(0).Charts.Add(chart)Context Menu
You can set the view type to 2D or 3D by using the chart context menu.
Right-click the Chart control on the form at design time.
Select ViewType in the context menu and set the type.
Using the Spread Designer
You can set the view type to 2D or 3D using the properties window in the designer.
Select the Chart control in the designer.
The ViewType setting is under the Behavior category in the Properties window on the right side of the designer (selected item section).
Click Apply and Exit to close the Spread Designer.