You can move and resize the Chart control at design time in the Spread Designer or at run time.
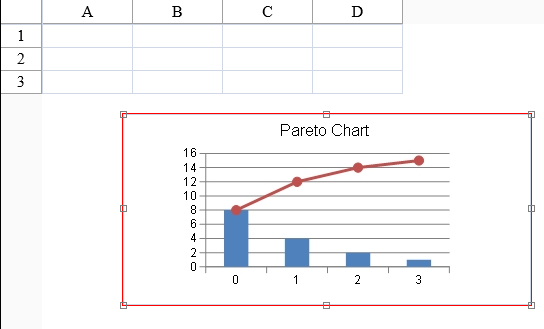
At design time or run time you can move the chart by clicking on it and then dragging the chart on the Spread control with the mouse or you can click on the chart and use the keyboard direction keys. You can resize the chart by selecting it, moving the mouse pointer over one of the indicators and waiting until the mouse pointer changes to a left-right icon or an up-down icon, and then dragging. The following image shows the red outline and indicator symbols.
At run time you can allow the user to move or resize the Chart control by setting the CanSize and CanMove properties. The CanSelect property must be true to allow moving and resizing.
Set the CanSize and CanMove properties in the SpreadChart class.
The following example sets the CanSize and CanMove properties.
| C# |
Copy Code
|
|---|---|
FarPoint.Web.Spread.Chart.SpreadChart chart = new FarPoint.Web.Spread.Chart.SpreadChart; chart.Model = model; chart.CanSize = true; chart.CanMove = false; fpSpread1.Sheets[0].Charts.Add(chart); |
|
| VB |
Copy Code
|
|---|---|
Dim chart As New FarPoint.Web.Spread.Chart.SpreadChart() chart.Model = model chart.CanSize = True chart.CanMove = False FpSpread1.Sheets(0).Charts.Add(chart) |
|