
-
Spread for ASP.NET 18 Product Documentation
-
Developer's Guide
- Getting Started
- Understanding the Product
- Namespaces Overview
- Working with the Spread Designer
- Customizing User Interaction
- Customizing the Appearance
- Customizing with Cell Types
- Managing Data Binding
- Managing Data in the Component
- Managing Formulas
- Managing File Operations
- Using Sheet Models
- Maintaining State
- Working with the Chart Control
- Using Touch Support with the Component
- Assembly Reference
- Client-Side Scripting Reference
- Import and Export Reference
-
Developer's Guide
Creating the Chart Control
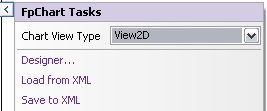
You can create a Chart control with code or with the Chart Designer. Select the Chart control, click on the chart verb, and then select Designer to bring up the Chart Designer.
You can also create a chart with code. The code is similar to using the Chart control in Spread; however, you do not need the AddChart method in this case.
Using Code
Use the BarSeries class to add data to a Chart control.
Use the YPlotArea class to create a plot area.
Set the location and size of the plot area.
Add the series to the plot area.
Create a label and legend for the chart.
Create a chart model and add the plot area, label, and legend to the model.
Add the chart model to the Chart control.
Example
The following example creates a bar type chart with a label and legend.
FarPoint.Web.Chart.BarSeries series = new FarPoint.Web.Chart.BarSeries();
series.SeriesName = "Series 0";
series.Values.Add(2.0);
series.Values.Add(4.0);
series.Values.Add(3.0);
series.Values.Add(5.0);
FarPoint.Web.Chart.YPlotArea plotArea = new FarPoint.Web.Chart.YPlotArea();
plotArea.Location = new System.Drawing.PointF(0.2f, 0.2f);
plotArea.Size = new System.Drawing.SizeF(0.6f, 0.6f);
plotArea.Series.Add(series);
FarPoint.Web.Chart.LabelArea label = new FarPoint.Web.Chart.LabelArea();
label.Text = "Bar Chart";
label.Location = new System.Drawing.PointF(0.5f, 0.02f);
label.AlignmentX = 0.5f;
label.AlignmentY = 0.0f;
FarPoint.Web.Chart.LegendArea legend = new FarPoint.Web.Chart.LegendArea();
legend.Location = new System.Drawing.PointF(0.98f, 0.5f);
legend.AlignmentX = 1.0f;
legend.AlignmentY = 0.5f;
FarPoint.Web.Chart.ChartModel model = new FarPoint.Web.Chart.ChartModel();
model.LabelAreas.Add(label);
model.LegendAreas.Add(legend);
model.PlotAreas.Add(plotArea);
FpChart1.Model = model;
Dim series As New FarPoint.Web.Chart.BarSeries()
series.SeriesName = "Series 0"
series.Values.Add(2.0)
series.Values.Add(4.0)
series.Values.Add(3.0)
series.Values.Add(5.0)
Dim plotArea As New FarPoint.Web.Chart.YPlotArea()
plotArea.Location = New System.Drawing.PointF(0.2f, 0.2f)
plotArea.Size = New System.Drawing.SizeF(0.6f, 0.6f)
plotArea.Series.Add(series)
Dim label As New FarPoint.Web.Chart.LabelArea()
label.Text = "Bar Chart"
label.Location = New System.Drawing.PointF(0.5f, 0.02f)
label.AlignmentX = 0.5f
label.AlignmentY = 0.0f
Dim legend As New FarPoint.Web.Chart.LegendArea()
legend.Location = New System.Drawing.PointF(0.98f, 0.5f)
legend.AlignmentX = 1.0f
legend.AlignmentY = 0.5f
Dim model As New FarPoint.Web.Chart.ChartModel()
model.LabelAreas.Add(label)
model.LegendAreas.Add(legend)
model.PlotAreas.Add(plotArea)
FpChart1.Model = model