You can specify the color, type, and size of the border that goes around the edge of the Chart control.
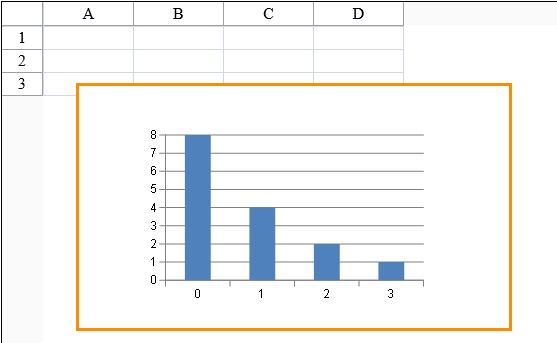
The following example creates an orange border around the Chart control.
| C# |
Copy Code
|
|---|---|
FarPoint.Web.Spread.Chart.SpreadChart chart = new FarPoint.Web.Spread.Chart.SpreadChart;
chart.BorderColor = Drawing.Color.DarkOrange;
chart.BorderStyle = BorderStyle.Solid;
chart.BorderWidth = 3;
fpSpread1.Sheets[0].Charts.Add(chart);
|
|
| VB |
Copy Code
|
|---|---|
Dim chart As New FarPoint.Web.Spread.Chart.SpreadChart() chart.BorderColor = Drawing.Color.DarkOrange chart.BorderStyle = BorderStyle.Solid chart.chart.BorderWidth = 3 FpSpread1.Sheets(0).Charts.Add(chart) |
|