
-
Spread for ASP.NET 18 Product Documentation
-
Developer's Guide
- Getting Started
- Understanding the Product
- Namespaces Overview
- Working with the Spread Designer
- Customizing User Interaction
- Customizing the Appearance
- Customizing with Cell Types
- Managing Data Binding
- Managing Data in the Component
- Managing Formulas
- Managing File Operations
- Using Sheet Models
- Maintaining State
- Working with the Chart Control
- Using Touch Support with the Component
- Assembly Reference
- Client-Side Scripting Reference
- Import and Export Reference
-
Developer's Guide
Line Charts
The line chart can be a radar plot such as the one shown in this figure.
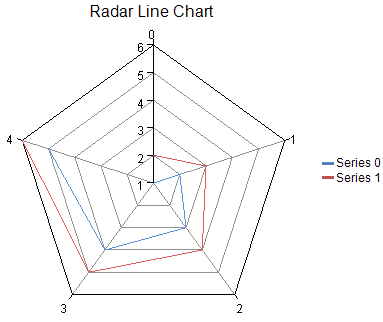
Each point has a single data value: y. Each point is visualized as a point on a line.
A radar line series can be assigned a border, fill effect, and a depth for the line. Each point can be assigned a border and a fill effect for the line. Assigning null for a border or fill effect indicates that the property is unset. Depth is measured relative to the plot area depth (0 = no depth, 1 = depth of plot area).
For more information on the line series object in the API, refer to the RadarLineSeries class.