


-
Spread for ASP.NET Product Documentation
-
Developer's Guide
- Getting Started
- Understanding the Product
- Namespaces Overview
- Working with the Spread Designer
- Customizing User Interaction
- Customizing the Appearance
- Customizing with Cell Types
- Managing Data Binding
- Managing Data in the Component
- Managing Formulas
- Managing File Operations
- Using Sheet Models
- Maintaining State
- Working with the Chart Control
- Using Touch Support with the Component
- Assembly Reference
- Client-Side Scripting Reference
- Import and Export Reference
-
Developer's Guide
Pie Plot Types
A pie plot area contains series that have values in one dimension. When visualized in two dimensions, a pie plot area takes the form of a circle (or partial circle). When visualized in three dimensions, a pie plot area takes the form of a disk (or partial disk). The following image displays a three dimensional chart.
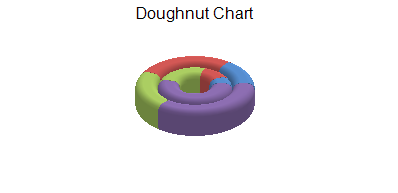
You can have any of these types of Pie plots:
For details on the API, refer to the PiePlotArea class.