


-
Spread for ASP.NET Product Documentation
-
Developer's Guide
- Getting Started
- Understanding the Product
- Namespaces Overview
- Working with the Spread Designer
- Customizing User Interaction
- Customizing the Appearance
- Customizing with Cell Types
- Managing Data Binding
- Managing Data in the Component
- Managing Formulas
- Managing File Operations
- Using Sheet Models
- Maintaining State
- Working with the Chart Control
- Using Touch Support with the Component
- Assembly Reference
- Client-Side Scripting Reference
- Import and Export Reference
-
Developer's Guide
Elevation and Rotation
The elevation rotates the graph counterclockwise around the horizontal axis. The following image displays a graph with a changed elevation.
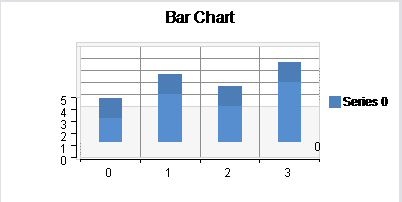
For API information, see the Elevation property.
The rotation rotates the graph counterclockwise around the vertical axis. The following image displays a graph with a changed rotation.
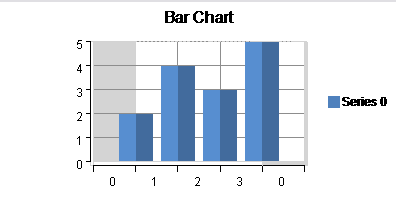
For API information, see the Rotation property.
Using Code
You can set the Elevation and Rotation properties.
Example
The following example sets Elevation and Rotation. Use this code with a 3D chart.
YPlotArea plotArea = new YPlotArea();
plotArea.Location = new PointF(0.2f, 0.2f);
plotArea.Size = new SizeF(0.6f, 0.6f);
plotArea.Rotation = 20;
plotArea.Elevation = 15;
Dim plotArea As New FarPoint.Web.Chart.YPlotArea()
plotArea.Location = New System.Drawing.PointF(0.2F, 0.2F)
plotArea.Size = New System.Drawing.SizeF(0.6F, 0.6F)
plotArea.Rotation = 20
plotArea.Elevation = 15