


-
Spread for ASP.NET Product Documentation
-
Developer's Guide
- Getting Started
- Understanding the Product
- Namespaces Overview
- Working with the Spread Designer
- Customizing User Interaction
- Customizing the Appearance
- Customizing with Cell Types
- Managing Data Binding
- Managing Data in the Component
- Managing Formulas
- Managing File Operations
- Using Sheet Models
- Maintaining State
- Working with the Chart Control
- Using Touch Support with the Component
- Assembly Reference
- Client-Side Scripting Reference
- Import and Export Reference
-
Developer's Guide
Pie Charts
The pie chart can be a pie plot such as the one shown in this figure.
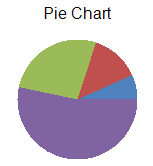
Each point in a pie series has a single data value. Each point is visualized as a pie slice.
A pie series can be assigned a border and fill effect for the pie slices. Assigning null for a border or fill effect indicates that the property is null.
Each point can be assigned a border, fill effect, and a detachment distance for the pie slice. Detachment distance is measured relative to pie radius (0 = no detachment, 1 = detachment is length of pie radius). The detachment distance (PieDetachments property) is used to create an exploded pie chart.
For more information on the pie series object in the API, refer to the PieSeries class.