-
Spread for ASP.NET Product Documentation
-
Developer's Guide
- Getting Started
- Understanding the Product
- Namespaces Overview
- Working with the Spread Designer
- Customizing User Interaction
- Customizing the Appearance
- Customizing with Cell Types
- Managing Data Binding
- Managing Data in the Component
- Managing Formulas
- Managing File Operations
- Using Sheet Models
- Maintaining State
- Working with the Chart Control
- Using Touch Support with the Component
- Assembly Reference
- Client-Side Scripting Reference
- Import and Export Reference
-
Developer's Guide
Data Plot Types
Data charts are charts that can be bound. Any series in any of the plot types can be bound to a data source using the data source property in the series class. You can use any of these types of data sources:
- Array
- List
- Table
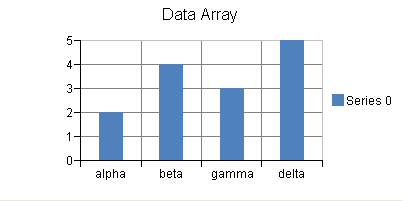
The array data chart can be a one-dimensional plot such as the one shown in this figure. This array chart shows the bars alongside each other vertically.
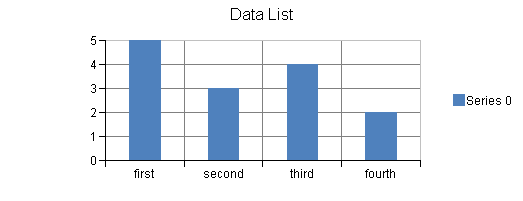
The following is an example of a bar chart bound to a list data source:
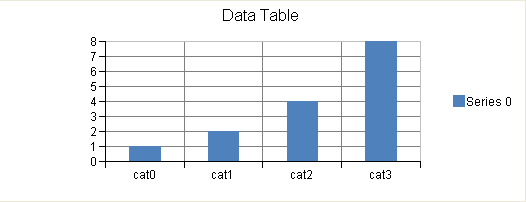
The following is an example of a bar chart bound to a table data source: