


-
Spread for ASP.NET Product Documentation
-
Developer's Guide
- Getting Started
- Understanding the Product
- Namespaces Overview
- Working with the Spread Designer
- Customizing User Interaction
- Customizing the Appearance
- Customizing with Cell Types
- Managing Data Binding
- Managing Data in the Component
- Managing Formulas
- Managing File Operations
- Using Sheet Models
- Maintaining State
- Working with the Chart Control
- Using Touch Support with the Component
- Assembly Reference
- Client-Side Scripting Reference
- Import and Export Reference
-
Developer's Guide
Stripe Charts
The stripe chart can be a radar plot such as the one shown in this figure.
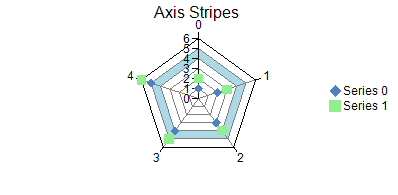
You can specify a start and end value for the stripe on the chart axis. You can also specify a fill type and color for the stripe. A stripe can be added to a chart with the axis properties in the appropriate plot area class.
For more information on the stripe object in the API, refer to the Stripe class.