Line Marker
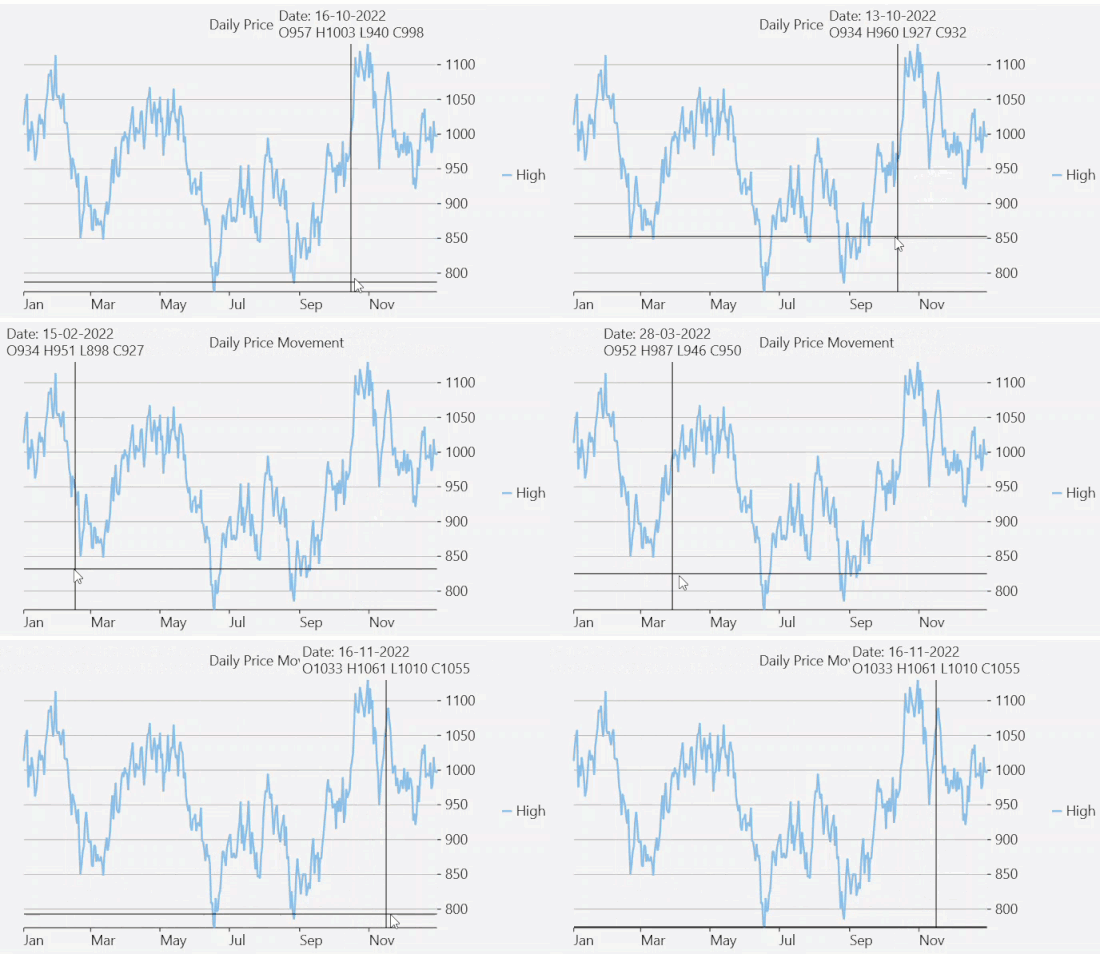
Line Marker displays the precise data values for a given position on the chart by dragging horizontal and/or vertical lines over the plot with an attached label. It is useful in scenarios, where a user has a lot of data in a line or area chart, or if a user wants to display data from multiple series in a single label. With built-in interactions, such as drag and move. a user can drag the line marker and more precisely select the data point on the chart.
To create a line marker and use it in FlexChart, you need to create an instance of the C1LineMarker class and add it to the Layers collection of the chart by using Layers property of the FlexChart class. You can also set the visibility of the LineMarker lines by using the Lines property provided by C1LineMarker class. The Lines property accepts the following values from the LineMarkerLines enumeration:
- Both: Shows both vertical and horizontal lines
- Horizontal: Shows a horizontal line
- Vertical: Shows a vertical line
- None: Shows no line
Additionally, you can set the interaction mode of the line marker by setting the Interaction property of the C1LineMarker class to any of the following values in the LineMarkerInteraction enumeration:
- Drag: Allows the line marker to move when the user drags the line.
- Move: Allows the line marker move with the pointer. It is the default value for the interaction mode.
- None: Does not allow any interaction. The user can specify the position by clicking.
Note that if you set the Interaction property to Drag, you need to set the DragContent and DragLines properties to specify whether the content and values linked with the line marker lines are draggable or not. Furthermore, you can set the initial position of the line marker relative to the plot area with the help of VerticalPosition and HorizontalPostion properties. The acceptable range for these properties is [0,1].
Position Line Marker Content
When using line markers, the content displayed with them can sometimes hide the chart or plot area, making it difficult to read. To improve clarity and visualization, you can position the line marker content outside the plot area by using the Alignment property of the C1LineMarker class. This property specifies the marker's position relative to the plotted data using the LineMarkerAlignment enumeration, which offers the following options which allow you to easily place the line marker content outside the plot area and over the axes for enhanced readability.
| Options | Description |
|---|---|
| PlotTop | Aligns the line marker to the top of the pointer. |
| PlotBottom | Displays the line marker content at the bottom of the plot, below the plot area. |
| PlotRight | Displays the line marker content on the right side of the plot. |
| PlotLeft | Displays the line marker content on the left side of the plot. |

The following code showcases how to align the line marker content at the top of the pointer.
XAML Code
<Grid.RowDefinitions>
    <RowDefinition Height="Auto" />
    <RowDefinition />
</Grid.RowDefinitions>
<StackPanel Orientation="Horizontal" Margin="10 0">
</StackPanel>
<c1:FlexChart x:Name="flexChart" ChartType="Line"
              ItemsSource="{Binding DataContext.Data}"
              BindingX="Date"
              Grid.Row="1" Header="Daily Price Movement">
    <c1:FlexChart.AxisX>
        <c1:Axis LabelAlignment="Left" />
    </c1:FlexChart.AxisX>
    <c1:FlexChart.AxisY>
        <c1:Axis Position="Right" MajorGrid="True" AxisLine="False" />
    </c1:FlexChart.AxisY>
    <c1:Series Binding="High" SeriesName="High" >
        <c1:Series.Style>
            <c1:ChartStyle StrokeThickness="2" />
        </c1:Series.Style>
    </c1:Series>
    <c1:FlexChart.Layers>
        <c1:C1LineMarker x:Name="marker" Alignment="PlotTop" Lines="Both" Interaction="Move" PositionChanged="PositionChanged" />
    </c1:FlexChart.Layers>
</c1:FlexChart>
Code
Dataservicecountry dataService = Dataservicecountry.GetService();
public Linemarker()
{
    this.InitializeComponent();
}
void PositionChanged(object sender, PositionChangedArgs e)
{
    var pt = e.Position;
    var dataPoint = flexChart.PointToData(e.Position);
    var date = DateTime.FromOADate(dataPoint.X);
    var i = (int)(date.Date - Data[0].Date).TotalDays;
    if (i >= 0 && i < Data.Count)
    {
        var item = Data[i];
        marker.Content =
            $"Date: {item.Date.ToShortDateString()}\n" +
            $"O{item.Open} H{item.High} L{item.Low} C{item.Close}";
    }
}
List<Quote> _data;
public List<Quote> Data => _data != null ? _data : _data = dataService.CreateFinancialData(new DateTime(2022, 1, 1), 365);


