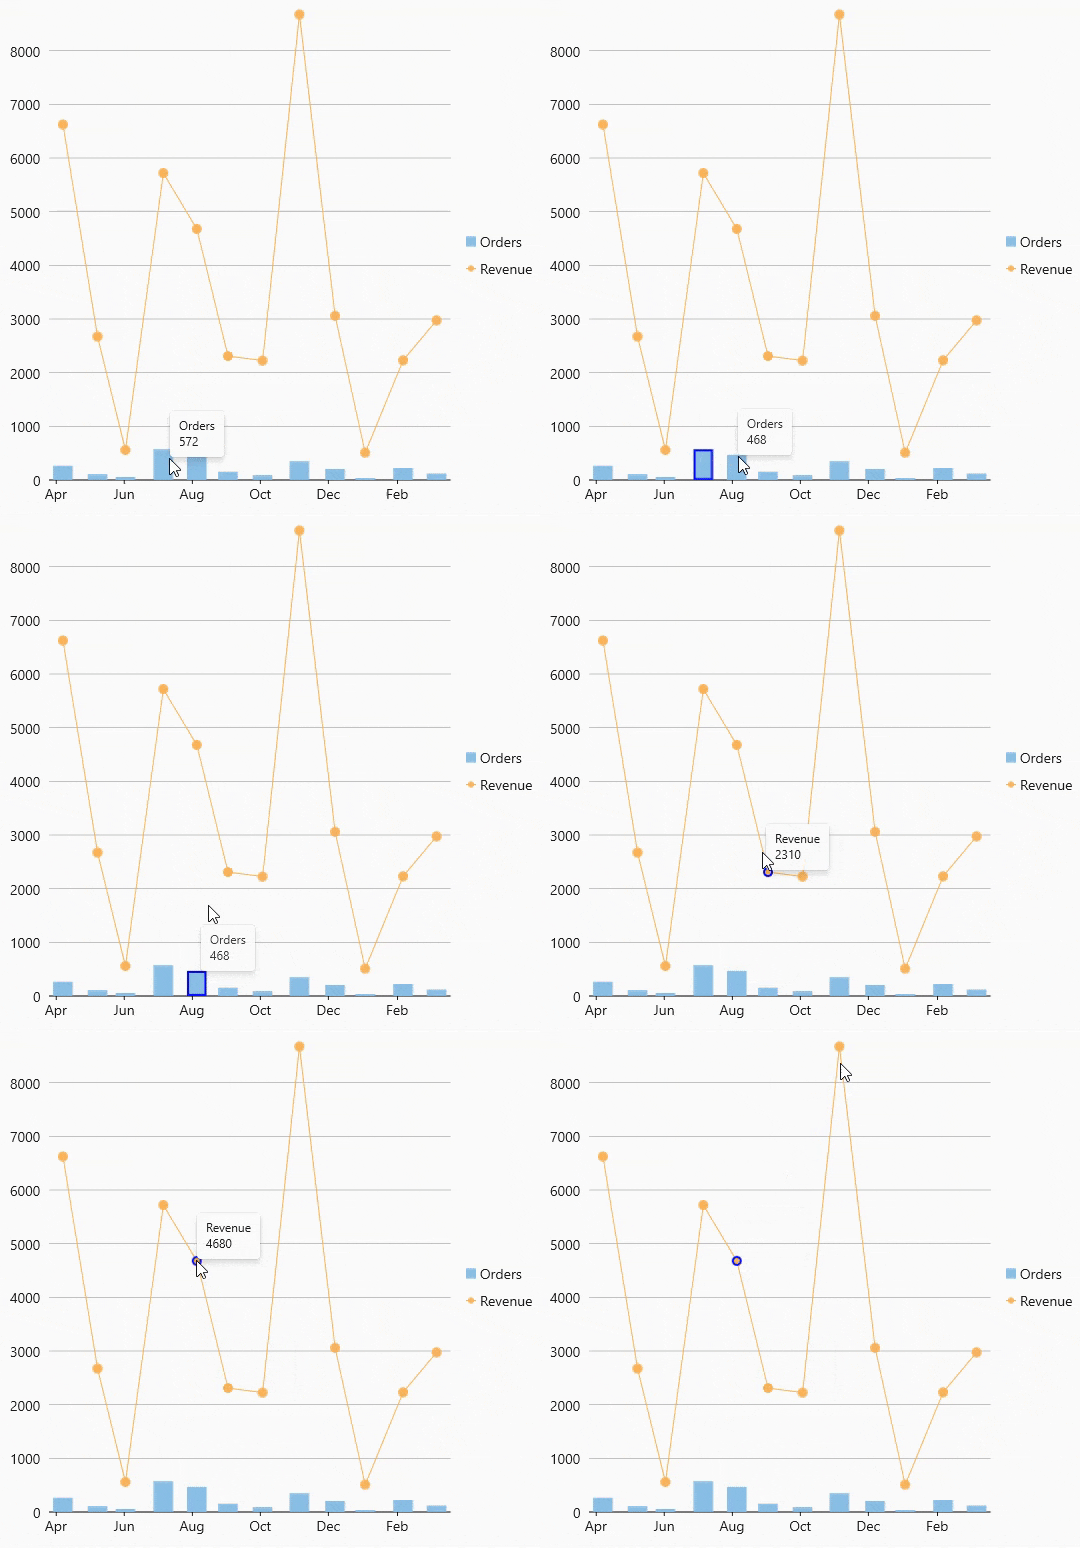
Selection in charts helps the end-user to select the required data point or the whole series at run-time during analysis, etc.
In FlexChart, selection is disabled by default. However, you can enable the selection by setting the SelectionMode property. This property allows you to set the selection mode to either Series or Point using the ChartSelectionMode enumeration. FlexChart also lets you get or set the index of the selected item using the SelectedIndex property. Moreover, it provides a SelectionChanged event which notifies when the selected point or series is changed so that you can customize the selection process according to the requirements. You can also customize how a selected item should appear by using the SelectionStyle property. The property is of ChartStyle type and lets you change the fill, fill color, stroke, stroke color, line pattern etc.
 |
Following C# code is required to show the selection in charts at runtime. This sample uses the same datasource as used in Quick Start.
| XAML |
Copy Code
|
|---|---|
flexChart.SelectionMode = ChartSelectionMode.Point;
flexChart.SelectedIndex = 2;
flexChart.SelectionStyle = new C1.WinUI.Chart.ChartStyle()
{
    Stroke = new SolidColorBrush(Windows.UI.Color.FromArgb(255, 0, 0, 255)),
    StrokeThickness = 2
};
|
|