Hit Test
The HitTest method is used to determine X and Y coordinates, as well as the index of a point on the FlexChart where the user taps. This method is helpful in scenarios such as displaying tooltips that lies outside the series of the FlexChart.
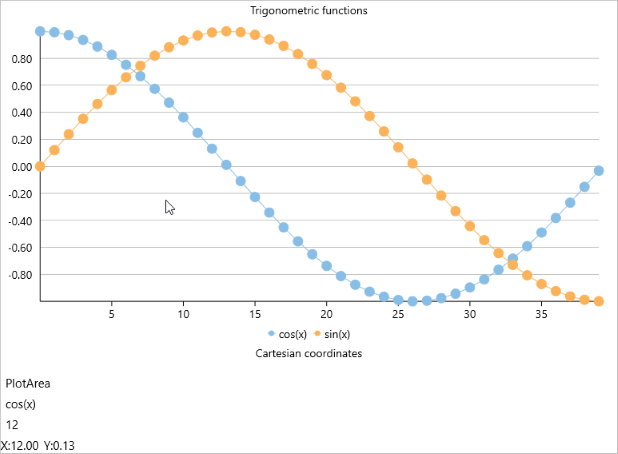
The following image shows a LineSymbol chart with the index of the tapped point on the chart.

The following code examples demonstrate how to define the chart_Tapped event. This event invokes the HitTest() method to retrieve the information of the tapped point in the FlexChart region and displays it in the chart footer.
Create a new Cross Platform App and open the MainPage.xaml page.
In the MainPage.xaml page, replace the existing code with following code.
<ContentPage xmlns="http://xamarin.com/schemas/2014/forms"
             xmlns:x="http://schemas.microsoft.com/winfx/2009/xaml"
             xmlns:c1="clr-namespace:C1.Xamarin.Forms.Chart;assembly=C1.Xamarin.Forms.Chart"
             xmlns:local="clr-namespace:Flexchart_HitTest"
             x:Class="Flexchart_HitTest.MainPage">
  <StackLayout>
    <Grid VerticalOptions="FillAndExpand">
      <c1:FlexChart x:Name="flexChart" Tapped="flexChart_Tapped"
                Header="Trigonometric functions" Footer="Cartesian coordinates"
                BindingX="X" ChartType="LineSymbols" LegendPosition="Bottom" >
        <c1:FlexChart.Series>
          <c1:ChartSeries x:Name="seriesCosX"  Binding="Y" SeriesName="cos(x)"  />
          <c1:ChartSeries x:Name="seriesSinX"  Binding="Y" SeriesName="sin(x)"  />
        </c1:FlexChart.Series>
      </c1:FlexChart>
    </Grid>
    <Grid>
      <Grid.RowDefinitions>
        <RowDefinition Height="Auto"/>
      </Grid.RowDefinitions>
      <StackLayout x:Name="stackHitTest" VerticalOptions="Fill">
        <StackLayout Orientation="Horizontal">
          <Label x:Name="lblChartElement" />
          <Label  Text="{Binding ChartElement}" />
        </StackLayout>
        <StackLayout x:Name="stackSeries">
          <StackLayout Orientation="Horizontal">
            <Label x:Name="lblSeriesName" />
            <Label  Text="{Binding Series.SeriesName}" />
          </StackLayout>
          <StackLayout x:Name="stackData">
            <StackLayout Orientation="Horizontal">
              <Label x:Name="lblPointIdx" />
              <Label  Text="{Binding PointIndex}" />
            </StackLayout>
            <StackLayout Orientation="Horizontal" >
              <Label  Text="{Binding X, StringFormat='X:{0:F2}'}" />
              <Label  Text="{Binding Y, StringFormat='Y:{0:F2}'}" />
            </StackLayout>
          </StackLayout>
        </StackLayout>
      </StackLayout>
    </Grid>
 </StackLayout>
Open the MainPage.xaml.cs page from the Solution Explorer and add the following code to implement HitTest functionality at runtime.
public partial class HitTest : ContentPage
   {
       public HitTest()
       {
           InitializeComponent();
           int len = 40;
           List<Point> listCosTuple = new List<Point>();
           List<Point> listSinTuple = new List<Point>();
           for (int i = 0; i < len; i++)
           {
               listCosTuple.Add(new Point(i, Math.Cos(0.12 * i)));
               listSinTuple.Add(new Point(i, Math.Sin(0.12 * i)));
           }
           this.flexChart.AxisY.Format = "n2";
           this.seriesCosX.ItemsSource = listCosTuple;
           this.seriesSinX.ItemsSource = listSinTuple;
       }
       void flexChart_Tapped(object sender, C1.Xamarin.Forms.Core.C1TappedEventArgs e)
       {
           var hitTest = this.flexChart.HitTest(e.HitPoint);
           this.stackHitTest.BindingContext = hitTest;
           this.stackData.BindingContext = hitTest;
           this.stackSeries.IsVisible = hitTest != null && hitTest.Series != null;
           this.stackData.IsVisible = hitTest != null && hitTest.PointIndex != -1;
       }
   }


