Line Marker
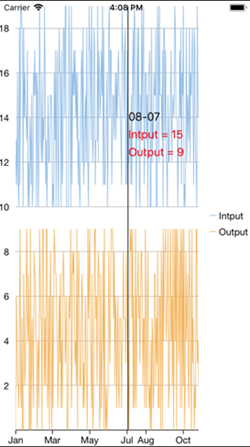
Line marker is a line that is drawn on chart plot and bound to some value on an axis. It may be used to show a trend or mark an important value on the chart. It displays the lines over the plot with an attached label. It is useful in scenarios, where a user has a lot of data in a line or area chart, or if a user wants to display data from multiple series in a single label. With built-in interactions, such as Drag and Move, a user can drag the line marker to select the data point on the chart more precisely.
If you set the Interaction property to Drag, you need to set the DragContent and the DragLines property to specify whether the content and values linked with the line marker lines are draggable or not.
To implement LineMarkers in the FlexChart, we use the following key properties.
- Interaction - It specifies that how a user can interact with the line marker: drag, move or none. It is an important property that defines how you can interact move or drag the marker to get the data precisely on the FlexChart.
- Contents - It allows the user to display UI elements in the label. These elements can be bound to values from the DataPoints collection.
- Lines - It allows you to choose the type of Lines you want to display: vertical, horizontal, or both (cross-hair) line.
- Alignment - It allows you to set the position of the label relative to VerticalPosition or HorizontalPosition.
The image below shows how the FlexChart appears after LineMarker is added to it.

The following code examples demonstrate how to set these properties in C# and in XAML. This example uses the sample created in the Quick Start section.
In Code
Add the following code in the QuickStart.cs file to display line marker for FlexChart control.
public partial class MainPage : ContentPage
   {
       public MainPage()
       {
           InitializeComponent();
           this.flexChart.ItemsSource = new LineMarkerViewModel().Items;
           initMarker();
       }
       StackLayout layout = new StackLayout();
       Label xLabel = new Label();
       IList<Label> yLabels = new List<Label>();
       private void initMarker()
       {
           xLabel.VerticalOptions = LayoutOptions.FillAndExpand;
           xLabel.HorizontalOptions = LayoutOptions.FillAndExpand;
           layout.Children.Add(xLabel);
           for (int index = 0; index < flexChart.Series.Count; index++)
           {
               var series = flexChart.Series[index];
               var fill = (int)((IChart)flexChart).GetColor(index);
               Label yLabel = new Label();
               yLabel.VerticalOptions = LayoutOptions.FillAndExpand;
               yLabel.HorizontalOptions = LayoutOptions.FillAndExpand;
               var bytes = BitConverter.GetBytes(fill);
               yLabel.TextColor = Color.FromRgba(bytes[2], bytes[1], bytes[0], bytes[3]);
               yLabels.Add(yLabel);
               layout.Children.Add(yLabel);
           }
           lineMarker.Content = layout;
       }
       private void OnLineMarkerPositionChanged(object sender, PositionChangedArgs e)
       {
           if (flexChart != null)
           {
               var info = flexChart.HitTest(new Point(e.Position.X, double.NaN));
               int pointIndex = info.PointIndex;
               xLabel.Text = string.Format("{0:dd-MM}", info.X);
               for (int index = 0; index < flexChart.Series.Count; index++)
               {
                   var series = flexChart.Series[index];
                   var value = series.GetValues(0)[pointIndex];
                   var fill = (int)((IChart)flexChart).GetColor(index);
                   string content = string.Format("{0} = {1}", series.SeriesName, string.Format("{0:f0}", value));
                   Label yLabel = yLabels[index];
                   yLabel.Text = content;
               }
           }
       }
       public class LineMarkerViewModel
       {
           const int Count = 300;
           Random rnd = new Random();
           public List<LineMarkerSampleDataItem> Items
           {
               get
               {
                   List<LineMarkerSampleDataItem> items = new List<LineMarkerSampleDataItem>();
                   DateTime date = new DateTime(2016, 1, 1);
                   for (var i = 0; i < Count; i++)
                   {
                       var item = new LineMarkerSampleDataItem()
                       {
                           Date = date.AddDays(i),
                           Input = rnd.Next(10, 20),
                           Output = rnd.Next(0, 10)
                       };
                       items.Add(item);
                   }
                   return items;
               }
           }
           public List<string> LineType
           {
               get
               {
                   return Enum.GetNames(typeof(LineMarkerLines)).ToList();
               }
           }
           public List<string> LineMarkerInteraction
           {
               get
               {
                   return Enum.GetNames(typeof(LineMarkerInteraction)).ToList();
               }
           }
       }
       public class LineMarkerSampleDataItem
       {
           public int Input { get; set; }
           public int Output { get; set; }
           public DateTime Date { get; set; }
       }
   }
XAML Code
<?xml version="1.0" encoding="utf-8" ?>
<ContentPage xmlns="http://xamarin.com/schemas/2014/forms"
             xmlns:x="http://schemas.microsoft.com/winfx/2009/xaml"
             xmlns:local="clr-namespace:chartFeatures"
             xmlns:c1="clr-namespace:C1.Xamarin.Forms.Chart;assembly=C1.Xamarin.Forms.Chart"
             xmlns:interaction="clr-namespace:C1.Xamarin.Forms.Chart.Interaction;assembly=C1.Xamarin.Forms.Chart"
             x:Name=""
             x:Class="chartFeatures.MainPage">
<StackLayout>
        <Grid  VerticalOptions="FillAndExpand">
            <c1:FlexChart x:Name="flexChart" ChartType="Line" BindingX="Date" VerticalOptions="FillAndExpand" ShowTooltip="False">
                <c1:FlexChart.Series>
                    <c1:ChartSeries Binding="Input" SeriesName="Intput"/>
                    <c1:ChartSeries Binding="Output" SeriesName="Output"/>
                </c1:FlexChart.Series>
                <c1:FlexChart.AxisY>
                    <c1:ChartAxis MajorUnit="2" Position="Left" MajorGrid="True" AxisLine="False" MajorTickMarks="None" />
                </c1:FlexChart.AxisY>
                <c1:FlexChart.Layers>
                    <interaction:C1LineMarker x:Name="lineMarker"  DragContent="True" PositionChanged="OnLineMarkerPositionChanged">
                        <interaction:C1LineMarker.VerticalLineStyle>
                            <c1:ChartStyle Stroke="Gray" />
                        </interaction:C1LineMarker.VerticalLineStyle>
                        <interaction:C1LineMarker.HorizontalLineStyle>
                            <c1:ChartStyle Stroke="Gray" />
                        </interaction:C1LineMarker.HorizontalLineStyle>
                    </interaction:C1LineMarker>
                </c1:FlexChart.Layers>
            </c1:FlexChart>
        </Grid>
    </StackLayout>
</ContentPage>


