
Selection
You can choose what element of the FlexChart should be selected when the user taps on any region in a FlexChart by setting the SelectionMode property. This property accepts one of the following values from ChartSelectionModeType enum:
- None - Does not select any element.
- Point - Highlights the point that the user taps.
- Series - Highlights the series that the user taps. The user can tap the series on the plot itself, or the series name in the legend.
The images below show how the FlexChart appears after these properties have been set.
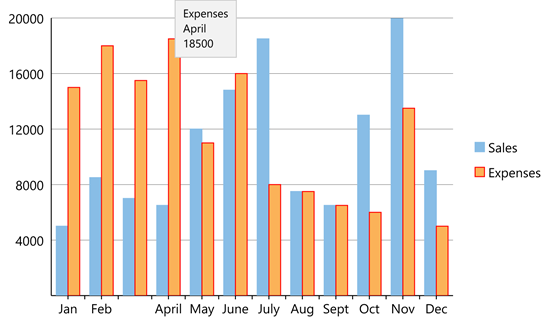
When SelectionMode is set to Series
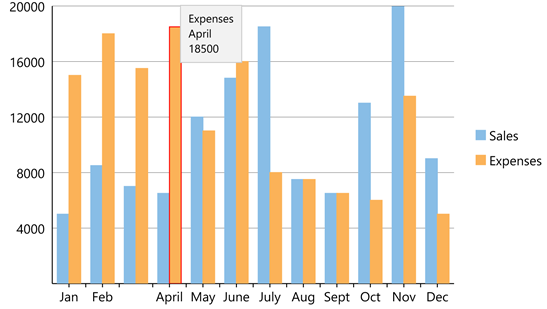
When SelectionMode is set to Point
The following code examples demonstrate how to set these properties in C# and XAML. This example uses the sample created in the Quick Start section.
In Code
//Create series
ChartSeries series = new ChartSeries();
series.SeriesName = "Sales";
series.Binding = "Sales";
series.ChartType = ChartType.Column;
chart.Series.Add(series);
ChartSeries series1 = new ChartSeries();
series1.SeriesName = "Expenses";
series1.Binding = "Expenses";
series1.ChartType = ChartType.Column;
chart.Series.Add(series1);
//Set selection mode
chart.SelectionMode = ChartSelectionModeType.Point;
In XAML
<c1:FlexChart x:Name="chart" ItemsSource="{Binding Data}" BindingX="Name" ChartType="Column"
    Grid.Row="1" Grid.ColumnSpan="2" VerticalOptions="FillAndExpand" SelectionMode="Point">
    <c1:FlexChart.Series>
        <c1:ChartSeries x:Name="Sales2015" SeriesName ="Sales" Binding="Sales" />
        <c1:ChartSeries x:Name="Expenses2015" SeriesName="Expenses" Binding="Expenses"/>
    </c1:FlexChart.Series>
</c1:FlexChart>