
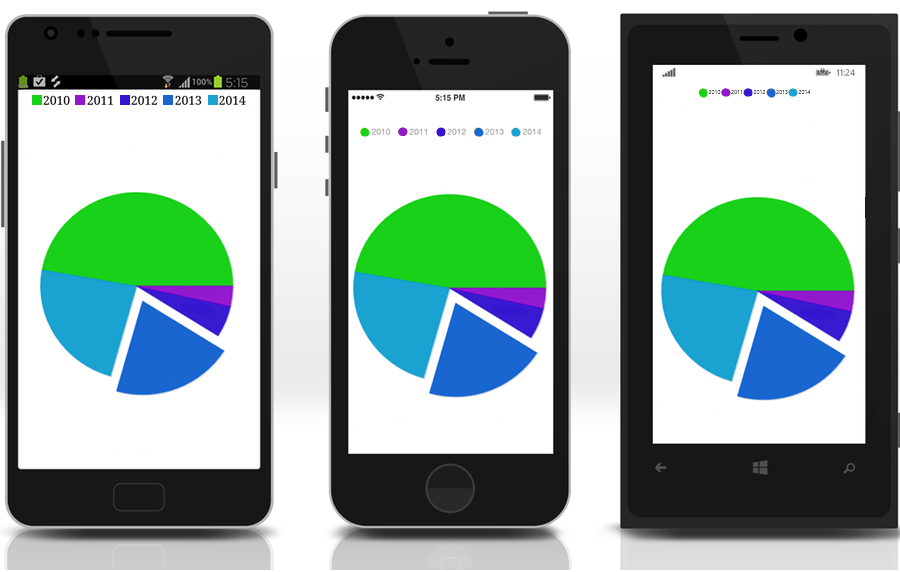
FlexPie
FlexPie allows you to create customized pie charts that represent a series as slices of a pie, wherein the arc length of each slice depicts the value represented by that slice. These charts are commonly used to display proportional data such as percentage cover. The multi-colored slices make pie charts easy to understand and usually the value represented by each slice is displayed with the help of labels.
Key Features
- Animation: Use Animation to add effects to your FlexPie.
- Scrolling & Zooming: Enable scrolling and touch based zooming for your pie charts, for a better view of bigger charts on a smaller screen.
- Touch Based Labels: Display values using touch based labels.
- Exploding and Donut Pie Charts: Use simple FlexPie properties to convert it into an exploding pie chart or a donut pie chart.
See Also
Quick Start: Add data to FlexPie
FlexChart