What's New in ActiveReports v18
ActiveReports v18.2 - October 23, 2024
Welcome to the latest update for ActiveReports.NET! We’re thrilled to introduce some exciting new features and improvements in version 18.2 that are designed to enhance your reporting experience. Let’s dive into the highlights and see how they can benefit you.
Enhanced XML Data Display in Web Designer
Navigating and understanding XML data just got a whole lot easier. In this update, we’ve improved how XML data is displayed in the Web Designer by introducing a tree structure for data fields. This intuitive display makes it much easier to explore and work with complex XML data, letting you focus more on designing your report rather than deciphering your data.

Windows Server 2025 Support
We’re excited to announce that ActiveReports 18 now supports Windows Server 2025. This enhancement ensures that our reporting tool can take advantage of the latest improvements in Windows Server, offering better security, performance, and reliability. With this update, you can confidently use ActiveReports in environments leveraging Windows Server 2025, knowing that your reporting solution is built on a stable and optimized platform.

ARM64 Support for Visual Studio Extension
ActiveReports is expanding its versatility! You can now install the ActiveReports Visual Studio extension on ARM-based systems, providing full access to our powerful reporting tool on ARM64 architecture. This is an important step towards ensuring you get a seamless and consistent reporting experience no matter your device.

Enhanced Section Report Groups in Web Designer
We’ve made some valuable enhancements to Section Reports to make report designing even easier. Now, you can effortlessly reorder groups with the "Move Group Up" and "Move Group Down" options in both the context menu and the Report Toolbar. This feature, now fully supported in the Web Designer, streamlines the process of organizing your report layout, saving you time and reducing the hassle of manual adjustments.
Improved Search for Multivalue Parameter Editor
Working with parameters should be simple and efficient, and that’s exactly what we’ve aimed for with our improved multivalue parameter editor. The enhanced search functionality allows you to easily find and remove parameter values, making it more straightforward to tailor your multivalue parameters to your specific reporting needs. This improvement is all about helping you stay in control, even when dealing with complex datasets.
We’re constantly working to make ActiveReports.NET even better, and we hope these updates make your reporting process smoother and more enjoyable. If you have any questions or feedback, feel free to reach out. We’d love to hear from you!
AR 18.3 Patch Notes
Task
- AR-34894 Updated viewer scrollbar styling to improve visibility during report preview.
- AR-34469 Ensured PDF export applies security
Permissionswhen encryption is enabled. - AR-34480 Enabled passing section report parameters into Barcode controls.
- AR-34561 Added proper formatting support for
DateOnlyvalues in TextBox withOutputFormat. - AR-35419 Added GIF image support in section reports.
- AR-35490 Improved handling of custom paper sizes when printing in AR 18.
- AR-36178 Added option to export invisible text via TextExport.
- AR-36295 Corrected PDF TOC/bookmark links to navigate to the right page/position.
- AR-34733 Improved mixed paper size/orientation handling when printing section reports.
- AR-34843 Aligned Viewer print button output to honor custom paper size in section reports.
- AR-35245 Stabilized VS designer after converting large code-based reports.
Bug
- AR-33911 Fixed BandedList footer sometimes appearing at the top of the page when
PrintAtBottom=True. - AR-34002 Fixed missing characters in PDF when exporting a detail section overlaid on a code section report.
- AR-34236 Fixed overlap of half-width and full-width characters when changing zoom in Blazor Viewer.
- AR-34361 Fixed upgrade log reporting incorrect uninstalled System reference versions.
- AR-34392 Fixed expressions like
=ReportItems!textbox1.Valuenot showing in preview. - AR-34431 Fixed inability to draw a line to the right edge in page reports.
- AR-34470 Fixed printing disabled when setting Blazor Viewer
DefaultExportSettings. - AR-34478 Fixed WebViewer rendering when
responseEncoding="Shift_JIS"is set. - AR-34505 Fixed Preview tab position when Designer’s Script tab is hidden.
- AR-34557 Fixed WebDesigner crash with page report + Chart in AR19.
- AR-34596 Fixed JSON data source connection failure when loading reports from resources on Linux.
- AR-34638 Fixed
Layer.TargetDeviceignored when usingCombineMode.ReportSections. - AR-34648 Fixed default paper size/margins overriding settings when combining page reports with
CombineMode.SubReports. - AR-34667 Fixed leading spaces trimmed for center-aligned TextBox when exporting to Excel.
- AR-34691 Fixed incorrect document name in print queue from JS Viewer when printing in Edge.
- AR-34699 Fixed
PrinterNameresetting to default when handlingSectionDocumentevents. - AR-34701 Fixed missing
PageNumberInSection/TotalPagesInSectionin page report expression editor (Web Designer). - AR-34703 Fixed “Could not load … System.Diagnostic.DiagnosticSource” error on MySQL validation.
- AR-34714 Fixed inability to drag & drop images onto the EUD designer surface.
- AR-34757 Fixed designer error after converting section reports with metafile images via file converter.
- AR-34829 Fixed intermittent inability to set MySQL data source in section reports.
- AR-34895 Fixed error when setting watermark images for section reports.
- AR-34903 Fixed
SectionReport.PrintProgressevent not firing. - AR-34918 Fixed voicing/half-voicing marks rendering with “Justify” alignment in GDI mode (.NET).
- AR-35017 Fixed inability to customize WebViewer toolbar when using
WebViewer.Reportproperty. - AR-35138 Reduced PDF file sizes compared to previous version.
- AR-35146 Fixed
App.configcausing compile errors after upgrade. - AR-35152 Fixed mismatched FormattedText display between design and preview.
- AR-35174 Fixed GIFs being converted to lower-quality JPEGs in section reports.
- AR-35178 Improved BlazorViewer scrollbar visibility to match v16 usability.
- AR-35415 Fixed “Previous/First page” buttons failing in consecutive-pages view in Blazor Viewer.
- AR-35422 Removed unnecessary properties from section report line-chart marker labels.
- AR-35498 Restored chart axis title editing in AxisBase Collection Editor (section report).
- AR-35528 Fixed PdfRE showing “?” instead of total page count.
- AR-35576 Fixed incomplete report rendering during preview.
- AR-35658 Fixed garbled characters when loading RPX into Code-based Section Report.
- AR-35666 Corrected Tablix
RepeatToFillbehavior. - AR-35733 Fixed abnormal behavior when using “Remove Spacing” in Web Designer toolbar.
- AR-35787 Fixed RTL TextBox rendering left-to-right in PDF.
- AR-35816 Fixed red selection frame showing on non-overlapping controls in designer.
- AR-35820 Fixed EUD null reference tied to
PropagateCulturein stack trace. - AR-35821 Fixed controls inside a container becoming visible when container visibility depends on
PageNumberexpressions. - AR-35847 Fixed
SectionDocument.Printerevent initialization when setting aSectionDocumentevent. - AR-35912 Fixed WebViewer failing to fetch report info after refresh.
- AR-35931 Enhanced upgrade log to include all required details.
- AR-35984 Fixed duplicated “New Style” properties in RPX chart.
- AR-35989 Fixed NullReferenceException on Preview in v18 for reports that work in v19.
- AR-36013 Fixed cases where a table cell could not output another table’s aggregate value.
- AR-36057 Fixed misaligned text input field when setting Center/Right Align in Web Designer.
- AR-36105 Fixed empty RTB in PDFs exported from RPX in GDI mode.
- AR-36107 Aligned FormattedText rendering between design and preview.
- AR-36108 Fixed IDE designer preview failure when SQLite is the data source.
- AR-36125 Fixed v16 reports with curly braces in file name failing to open in WebDesigner.
- AR-36133 Fixed WebViewer upgrade error “An item with the same key has already been added”.
- AR-36175 Fixed external (internet) images not rendering on preview in PageReport/Image.
- AR-36185 Fixed error when adding a section report as a new item via double-click in VS.
- AR-36187 Fixed “Object reference…” exception when previewing code-based section reports.
- AR-36190 Fixed missing X values in Section Chart wizard/VS designer with OLE DB data sources.
- AR-36192 Fixed “Failed to draw Chart” after changing a Chart’s data source.
- AR-36194 Localized JSON Data Source UI to JP and CN.
- AR-36198 Fixed VS Report Data Source dialog not opening when adding a Section Report.
- AR-36228 Fixed JSViewer error when images are missing in the report.
- AR-36239 Fixed TextBox with delayed expression content becoming hidden after refresh in Win Viewer.
- AR-36270 Fixed converter not removing GrapeCity references after conversion.
- AR-36272 Fixed inability to add JSON dataset and PostgreSQL data source in EUD.
- AR-36274 Fixed code-based report changes being saved without clicking “Save”.
- AR-36296 Removed duplicate “AR 18 Standalone Report” items when adding new items to AR projects.
- AR-35113 Fixed NullReferenceException when setting null to a section report subreport in 18.0J.
- AR-36020 Enabled setting
ClassNamein the designer for Code-based Section Reports.
AR 18.2 Patch Notes
Tasks
- AR-33481 As a report author I would like to reorder groups in Section Reports using the Web Designer
- AR-29642 ARM64 support for ActiveReports 16 Visual Studio Extension
- AR-30579 [Web Designer] Option to show XML Node Structure in Web Designer similar to the Desktop designer
- AR-32802 The behavior of the hidden field of the nested data set in the web designer differs from the behavior in the win designer
- AR-32803 Some Hyperlink added through script doesn't work for section report in JSViewer
- AR-33247 Reset the query when JSON-VQD opened if this query is invalid
- AR-33684 Handle VSIDE exception thrown when Oracle connection string is validated
- AR-33736 Windows Server 2025 support
- AR-33817 WebDesigner: 'Target device' property of Layers does not work in Content report.
- AR-33847 Update 'System.Text.Json version to 6.0.9
- AR-33874 AR.NET OSS packages update/monitoring (security, scan, vulnerabilities)
- AR-33909 To fix the absolute path traversal vulnerability of the UseFileStore implementation
- AR-33931 Change item order "prevent orphaned header" in Table smart panel
- AR-33932 [EndUserDesigner][ReportExplorer] | Unable to set BackColor for ReportExplorer.
- AR-33950 Upgrade GcDocs/GcExcel to 7.2
- AR-33951 Upgrade Microsoft.Data.SqlClient
- AR-33952 Upgrade blazor dependecies
- AR-33980 WebViewer: Skip rendering of images placed outside the project
- AR-33991 Microsoft.Data.SqlClient Remove packages with vulnerabilities.
- AR-33998 DS.Documents.Excel vulnerabilities
- AR-34000 PostgreSQL provider vulnerbilities
- AR-34187 Default value isn't presented in Object Browser for ReportCombiner
- AR-34230 Word, DOCX export ingnores the padding in TOC levels
- AR-34285 Width of the exported Excel file may differ from previous versions
- AR-33170 Add ReportSection Label to Excel
Fixes
- AR-31601 WebDesigner: TextBox size could descrease on preview upon changing Font Size
- AR-31602 Pinned parameter panel is collapsed when clicking on Preview button
- AR-32200 Child report header/footer is not entirely formatted when master report is set
- AR-32498 Zoom and Number of pages are flickering when refreshing the page on preview
- AR-32534 “Error: Invalid file format. The guids do not match“ appears when previewing an RPX report with RTF control exported to RDF
- AR-32606 Displays an incorrect title for a custom range when setting the "Amount" parameter to more than 1 in preview in Samples
- AR-32633 A display format isn't applied for multivalue date/date-time parameters without availble values.
- AR-32741 Rendering artifacts in toolbar upon loading the report in WinViewer
- AR-32769 Data set query failed to be validated as 'evaluatedValue' error when a parameter without default value is added in a query
- AR-33082 Report exported to doc has incorrect page size and margins
- AR-33226 Text in FormattedText control spanning more than one page appears clipped
- AR-33255 Zoom box & page box blink, when report is loaded in Viewer.
- AR-33370 PagesBackColor property doesn't work when a report is open
- AR-33422 Unable to set PrintWidth of Section report to > 800 inch in Web Designer
- AR-33428 WebDesigner: Error upon setting master report with a similar content
- AR-33436 WinViewer: Incorrect VerticalAlign for Justify TextAlign with Angle applied
- AR-33437 WebDesigner: CheckBox state can't be changed by click
- AR-33443 JSViewer: Data could be displayed in incorrect format upon Apply Parameters action
- AR-33444 Can't add value by d'n'd to Chart if Dataset has hierarchical structure
- AR-33465 Low-resolution icons used in Toolbox of EUD project
- AR-33475 Jump to bookmark doesn’t work for Chart Control in Galley mode in SVG render format if Chart and bookmark are placed on different pages
- AR-33478 Edit dataset validation error message for blank Excel sheets
- AR-33483 A name of a data field doesn’t reflect a name of a JSON node
- AR-33504 An unhandled exception occurs on saving a report with a deleted master report
- AR-33506 URL changed after export to HTML
- AR-33513 'Target device' property of Layers does not work in Content report.
- AR-33515 The "Go To First" button does not work correctly when previewing a report in the continuous page mode.
- AR-33545 "Left margin is bigger than paper width" error appears in 'Advanced' print dialog for some DataBinding samples
- AR-33550 "The type name 'Uri' could not be found in the namespace 'System'" error appears from time to time in Image export tests
- AR-33553 Performance issue when parameter has default value set to query value field
- AR-33583 Table of contents export Word exception
- AR-33586 In the preview of the Code-Based report, the font that was configured using report styles is not displayed
- AR-33607 Do we need to change the error message when importing Excel to an RPX report via the Console Import tool?
- AR-33629 HTML rendering issue with highlighted text in RichTextBox and FormattedText controls
- AR-33631 [SectionReport][Chart] | Spline Curve closes shape between first and last point.
- AR-33646 System.IO.FileNotFoundException is thrown when desktop sample is run with net8
- AR-33655 [WebDesigner] Heading indexes numeration is incorrect on preview and export when subreport table of contents is used
- AR-33664 Styles have disappeared from section report Chart Designer axis editor
- AR-33666 Missing scrollbar in the "2D" Tab of the Chart Wizard
- AR-33667 Incorrect extension when converting Rdlx report to Master in Classic EUD
- AR-33689 WinViewer is not initialized if loadDocument with Section report
- AR-33691 Export fails if report has two TOC-controls and report section Label is set.
- AR-33703 Alternating labels for charts don't work if animation is turned on
- AR-33754 Slow PDF export of report with chart containing large amount of data points in ActiveReports 18
- AR-33759 CrossPlatform: Text within the TextBox control of Section Report is cut off when the content is larger than a single page in WinViewer
- AR-33779 Different result is observed in multiple export of report with DVChart in NET8.0
- AR-33794 [WebDesigner][Angular] | WebDesigner crashes when used with Angular 18.
- AR-33814 Error upon previewing Content report in VS, when Master report isn't added to the project
- AR-33819 Unexpected line break issue with strings when using Font Resolver
- AR-33825 Error appears upon second printing from PrintMultiplePagesPerSheet sample
- AR-33827 Excel export .xlsx fails with a error when report fields contain XML unsupported characters
- AR-33829 PDF exported image looks different from preview
- AR-33880 Excel export error with 'Sections Per Sheet' sheet mode
- AR-33891 "Object reference ..." error when field from XML source is dropped to section report
- AR-33892 'Path should be flatten' exception occurs when report with chart is exported to HTML
- AR-33893 3D chart smooth line rendering looks broken
- AR-33906 Cannot add data source for page report/RDL report if solution contains setup project
- AR-33920 Issue noticed in viewer with long Table Of Contents items not displaying as expected
- AR-33924 Out of memory problem with ActiveReports 18 chart application with 9900 points
- AR-33929 Incorrect filling in chart shares on preview
- AR-33930 Report with Report Part exported to XML has invalid structure
- AR-33937 “?“ is shown instead of total number of pages
- AR-33940 WebDesigner: Save dialog hangs up on attempt to cancel onBeforeSave
- AR-33949 [Designer] | Drag-Dropping Bounded XML fields gives an 'Object reference not set to an instance of an object' error.
- AR-33957 JSViewer: Error appears on preview if external image isn't found
- AR-33967 Security token not being passed while printing report in JSViewer
- AR-33978 Index was out of range error occurs after merging cells in Tablix
- AR-33981 “?“ is shown instead of total number of pages (pdf export)
- AR-33984 HTML text background color appears incorrect in design time and preview
- AR-33994 Assembly System.Configuration.ConfigurationManager isn't found upon running AR projects
- AR-33996 Converter removes MESCIUS.ActiveReports.Core.Document.Drawing.Gdi dependency from project
- AR-33997 Vulnerability when injecting code into expression
- AR-34036 PrintProgress event of SectionDocument not getting triggered while the printing process is in progress
- AR-34155 WebDesigner: Error upon previewing report with Image taken from Dataset
- AR-34177 WebDesigner: the default styling looks abnormal when you create the table by Drag&Drop dataset
- AR-34186 Missed description for Subreports enum of CombineMode property in ObjectBrowser
- AR-34194 Duplicate Package reference upon adding AR report as a new item
- AR-34205 Incorrect Section name for Combined report
- AR-34206 Converter removes MESCIUS.ActiveReports.Core.DataProviders.Excel dependency
- AR-34209 Combining reports in Subreports mode causes error on preview
- AR-34215 Error in Visual Studio 2017 when adding AR Standalone Report item
- AR-34234 Error upon printing from a new AR report added as a new item
- AR-34240 When using the Blazor viewer, if you set the data source via parameters, the report may not be displayed
- AR-34241 System.Drawing.Printer.PrinterSettings worked fine with v16, but GrapeCity.ActiveReports.Printing.IPrinterSettings is throwing a null value exception in v18.1.1
- AR-34254 NullReferenceException occurs in Visual Studio when preview a section report with parameter set in a query
- AR-34271 Chart preview is not updated in the chart wizard after change the break-down method
- AR-34274 A Rendering error occurs on preview Spiral and Polar charts if a data field is added to the Chart Details
- AR-34286 JSViewer: Subreport isn't found if there is no extension in ReportName
- AR-34291 VSID: Add new report dialog may show the shared datasource from the wrong project
- AR-34298 JSViewer: SheetMode property for Section report in Excel export
- AR-34299 Json path to a selected by default node is not specified in the JSON VQD of section reports
- AR-34300 'Property value is not valid' error when modes are switched from GDI to CrossPlatform in section report that contains RichTextBox loaded with RTF
- AR-34332 Installer Typo
AR 18.2.1 Patch Notes
- AR-34468 ActiveReports toolbar is inactive in Visual Studio
- AR-34467 Converter doesn't start in VS
- AR-34341 Incorrect error message is displayed in Installer dialog when repair/uninstallation is cancelled
- AR-34336 JSviewer: Report can't be previewed if path to DB file is absolute
- AR-34220 [WebDesigner][Eval] | Use of eval function in web-designer.js
- AR-34429 ARM64 support.
- AR-34419 Issue with the ActiveReports 18 Designer when trying to validate a dataset
- AR-34414 Report with banded list shows error on preview after the changes of the banded header's height
- AR-34407 PDF Export: Picture rendering broken after Windows 11 24H2 update
- AR-34393 Update demo site to the release versions
- AR-34363 PDF Export: all TOC bookmarks lead to the last page if the report was exported with PagesRange option
- AR-34334 Update System.Text.Json / System.IO.Packaging
- AR-34240 When using the Blazor viewer, if you set the data source via parameters, the report may not be displayed
- AR-33886 Sign with MESCIUS certificate for v18 JP NuGet packages, for both new and legacy packages.
- AR-34022 The vertical scrollbar can be hidden in the section report script editor by resizing EUD window
AR 18.2.2 Patch Notes
Improvements & Updates
- AR-34587 - Updated: Upgraded to the latest version of
System.Text.Jsonfor improved performance and security. - AR-34624 - PDF Export: Added an option to specify the MIME type for embedded attachments.
- AR-34808 - WPF Viewer: Fixed an issue where page contents appeared cropped in multipage and continuous view modes.
- AR-34826 - PDF Export: Added support for specifying the modification date and relationship properties for embedded attachments.
- AR-34917 - PDF/UA Compliance: Fixed a missing "O" in
StructureAttributeto improve compliance. - AR-35275 - Security Update: Resolved a vulnerability in
esbuild 0.24.2.
Bug Fixes
- AR-34377 - Report Designer: Fixed an issue where opening an ActiveReports 19 (AR19) report containing a chart caused errors.
- AR-34555 - Excel Export (XLSX): Resolved an issue where exported section reports could not be opened in Excel.
- AR-34566 - JS Viewer: Fixed a bug where the "accent" and "accentText" theme colors were not applied correctly.
- AR-34626 - Lookup Function: Addressed an issue where the
Lookupfunction returned empty values when a dataset had a filter applied. - AR-34731 - RPC Server Error: Fixed an issue where users encountered "The RPC server is unavailable" error after upgrading to ActiveReports v18.2.1.
- AR-34757 - File Converter: Resolved an error that occurred when opening a section report in the designer after converting a report containing a metafile image.
- AR-34789 - Excel Export (XLSX): Fixed a second issue where section reports failed to open in Excel.
- AR-34814 - Subreport Processing: Addressed a
NullReferenceExceptionin theRestartSubReportsmethod when upgrading from ActiveReports 18.0.0 to 18.2.1. - AR-34920 - Report Designer: Fixed an issue where changes to the
ClassNameproperty were not saved. - AR-34940 - PDF Export: Resolved a failure when exporting reports containing tables with a line control inside a container.
- AR-34941 - PDF/UA Compliance: Fixed structure validation errors in PDF/UA exports.
- AR-34944 - RichTextBox Alignment: Corrected an issue where right-aligned text was sometimes misaligned.
- AR-35122 - DOCX Export: Fixed text corruption when exporting reports with mixed languages (e.g., English and Russian).
- AR-35255 - DOCX Export (Checkboxes): Improved the rendering of checkboxes in DOCX exports.
- AR-35268 - DOCX Export Crash: Fixed a
NullReferenceExceptionthat occurred when exporting reports to DOCX.
ActiveReports v18.1 - June 19, 2024
Hey everyone! Today, we’re happy to announce the arrival of ActiveReports.NET 18.1, the first of three service packs that will be released for ActiveReports.NET 18. As well as the usual fixes and performance optimizations, this update includes a handful of features requested by customers like you, which we will outline below!
Enriched Chart Customization
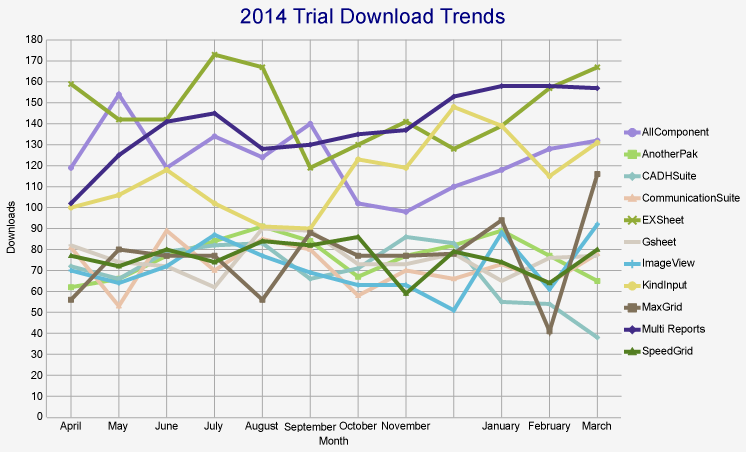
Before (SymbolSize 5, LabelRowCount 1)
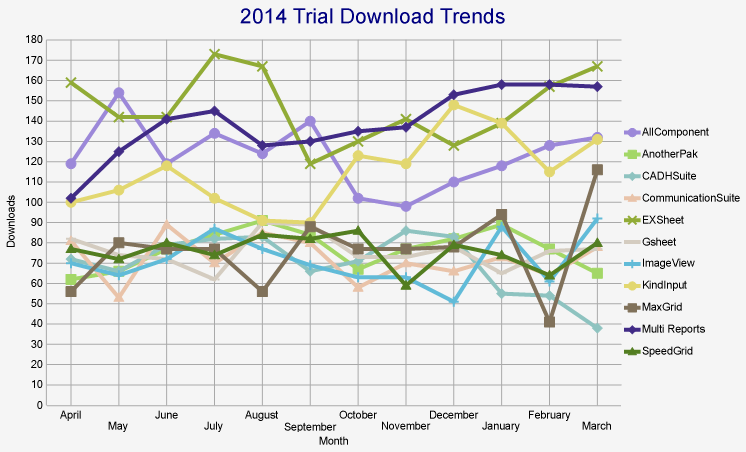
After (SymbolSize 10, LabelRowCount 2)
We have introduced new properties to enrich the customization and visual communication of charts for RDLX, Page, and Dashboard reports.
- LabelRowCount: This property, applied to the X-axis of charts, allows you to set the number of rows for axis labels, enabling a multi-row arrangement for better readability and organization of labels. Note that this feature is only applicable to charts that have an X-axis.
- SymbolSize: This property allows you to adjust the size of plot symbols, providing greater flexibility in data presentation. It is supported in the following chart types:
These updates aim to enhance the clarity and customization of your chart presentations.
Updated JSON Data Provider in Section Reports
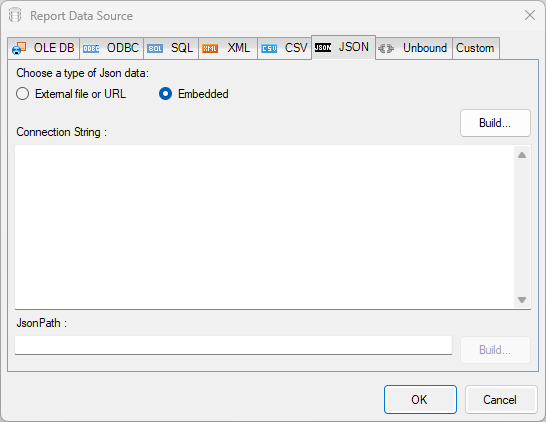
The JSON data provider in Section Reports now includes the Embedded option within the data source connection settings. This new feature allows you to embed JSON data directly into your reports, streamlining data management and simplifying the deployment process. The embedded option is particularly useful for development purposes, such as sharing reports with co-workers, as it ensures that all necessary data is contained within the report itself. This makes your reports more self-contained and less dependent on external sources, enhancing portability and ease of collaboration.
Enhanced SubReport in Section Reports
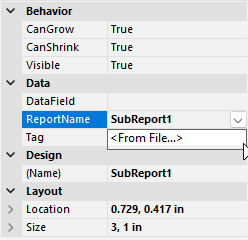
In Section Reports, you can now choose a report for the SubReport control directly through the ReportNameproperty, eliminating the need for code. This enhancement simplifies the process of adding subreports and is also available in the Web Designer. This update streamlines report design, making it easier and faster to create complex, nested reports.
Improved Tabular Data Display Options in Page and RDLX Reports
You now have greater control over the display of table data in Page and RDLX Reports with two new properties:
- MaxDetailsPerPage: This property allows you to set the maximum number of detail rows displayed per page. If the number of rows exceeds the specified value, a page break is added after the set number of rows.
- PreventOrphanedHeader: This option ensures that the table’s header or the table's group header always prints together with at least one detail row of the table or table group. This prevents headers from being isolated at the bottom of a page without accompanying data.
These features improve the readability and organization of table data in your reports, ensuring a more professional and polished presentation.
Document Map for Report Sections
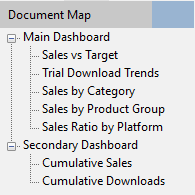
In RDLX and RDLX Dashboard Reports, report sections can now be displayed in the report viewer's Document Map and in the TableOfContents control in rendered or exported reports. To achieve this, you can use the newly introduced Label property of a report section. This enhancement provides better navigation and organization within your reports, making it easier for users to locate and reference specific sections.
Document Map | TableOfContents
New SheetMode Property for Excel Export
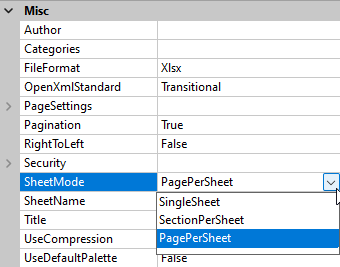
A new SheetMode property has been added to Excel export, allowing you to control how a report's pages or sections are exported. This property provides the flexibility to:
- Display each report page as a separate sheet
- Display each report section as a separate sheet
- Export the entire report as a single sheet
This feature enhances the organization and usability of exported Excel reports, making it easier to navigate and analyze the data.
AR 18.1 Patch Notes
- AR-32012 – Added property for alternating labels for Charts (LabelRowCount)
- AR-32366 – Added property for adjusting plot symbol size in Charts (SymbolSize)
- AR-32337 – Fixed an issue where frozen cells that had been merged would display incorrectly after scrolling
- AR-30792 – Added support for embedded JSON in Section Reports
- AR-30783 – Added “Bring to Front” and “Send to Back” buttons to adjust Z-index of report layers
- AR-30529 – Added property to set target SubReport in Section Reports without using a script (ReportName)
- AR-32952 – Added property for restricting the max number of details in a Table per page (MaxDetailsPerPage)
- AR-33217 – Added property to prevent Table headers from rendering on a page if there is not space for at least one detail row (PreventOrphanedHeader)
- AR-32297 – Fixed an issue with word-wrapping in HTML in the FormattedText control
- AR-31678 – Fixed an issue where Excel imports would fail on Linux/MacOS if libgdiplus was not installed
AR 18.1.1 Patch Notes
- AR-33744 – Fixed an issue where Japanese versions of the Visual Studio extensions would automatically update to the English version
- AR-33687 – Fixed an issue where MESCIUS.ActiveReports.Core.Rendering.dll was unsigned
- AR-33714 – Fixed an issue where custom themes for the JSViewer were being applied incorrectly
- AR-33497 – Fixed an issue where paper size was not reflected correctly when printing to a specific printer
- AR-33480 – Fixed an issue where paper size and orientation were not reflected properly when printing a Page Report
ActiveReports v18 - February 27, 2024
Hey everyone! We're happy to announce that ActiveReports.NET 18.0 is here! This is our annual major release update, and as usual, we will have two Service Packs to provide improvements and optimizations over the course of the year, as well as hotfix builds in between when necessary. We have some exciting new features coming with this one and a whole bunch of improvements that you’ll find listed below!
Ready to Dive into v18? Download ActiveReports.NET Today!
Customizable UI with Themes for JS Viewer and Web Designer
ActiveReports.NET 18 introduces theme support for both JS Viewer and Web Designer components, allowing you to personalize the user interface according to your preferences. Choose from a selection of built-in UI themes, or craft a custom theme to tailor the look and feel of these components to match your application's aesthetic or branding requirements.
Apply Themes to WebDesigner and Js Viewer Components | WebDesigner API | JS Viewer API

WinForms Viewer UI Design Refresh
The WinForms Viewer has undergone a design overhaul, offering a modernized and more user-friendly interface. This refresh improves the overall user experience by making report viewing more pleasant and intuitive.
.NET 8.0 Support
By supporting .NET 8.0, ActiveReports.NET 18 ensures compatibility with the latest .NET framework, allowing developers to utilize new features and improve their report applications.
Report Creation and Data Binding Wizard
A new wizard guides users through the steps of creating a basic report, simplifying the report design process for new or occasional users by providing a structured approach to report creation.
- Data Binding Wizard: This wizard streamlines the process of connecting reports to data sources, making it easier for users to bind their reports to various types of data and ensuring a smoother report design experience.
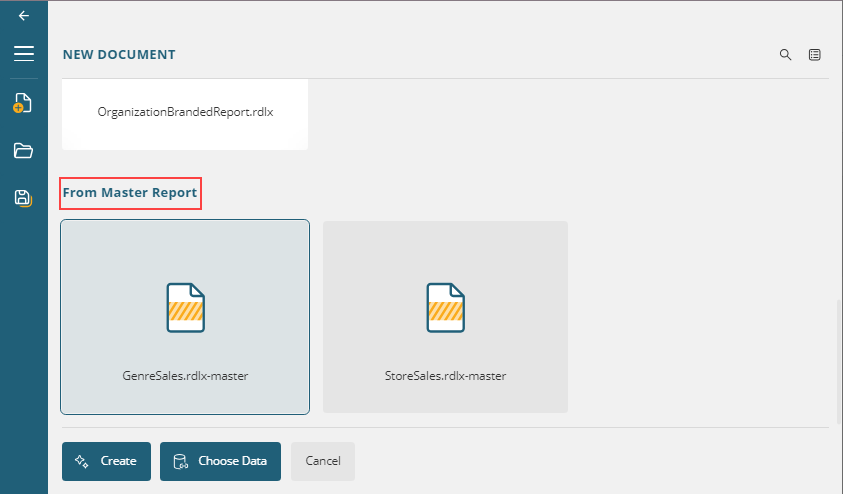
Master Reports in Web Designer
The introduction of master reports in the web designer enables users to create reusable report templates, streamlining the report design process and ensuring consistency across multiple reports.
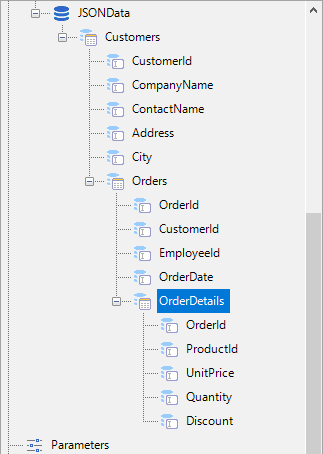
Nested JSON/XML Data Support
ActiveReports.NET 18 can now handle nested JSON and XML data, allowing more complex JSON data structures to be used as data sources. This feature makes working with modern web APIs and complex data models easier.
Nested Datasets (JSON and XML) | Nested Datasets
Improved SVG Rendering Quality and Performance in WinViewer
This feature enhances the quality and speed of Scalable Vector Graphics (SVG) rendering within the Windows Viewer. Users will experience crisper visuals and faster load times for SVG elements in their reports, leading to a more visually appealing and efficient reporting experience.
Enhanced Visual Studio Project Templates
In our commitment to streamlining your experience with ActiveReports.NET, we've introduced new Visual Studio project templates. These templates are designed to replace previous versions, offering a more intuitive and efficient start to your reporting projects.
- ActiveReports Windows Forms Application: Tailored for desktop environments, this template sets the stage for rich, interactive reports on Windows Forms
- ActiveReports ASP.NET Core Application: Perfect for web developers, this template integrates seamlessly with ASP.NET Core MVC for dynamic, server-side reporting
- ActiveReports Blazor Server Application: Leverage the power of Blazor Server to create interactive and real-time reporting applications
- ActiveReports Blazor WebAssembly Application: Build client-side reporting applications with the modern capabilities of Blazor WebAssembly
DataEngine Performance Improvements for Medium to Large Data Sets
By optimizing the DataEngine, ActiveReports.NET 18 significantly speeds up the processing of medium to large datasets. This improvement means quicker report generation and reduced waiting times for users working with substantial amounts of data, making the tool more suitable for data-intensive applications.
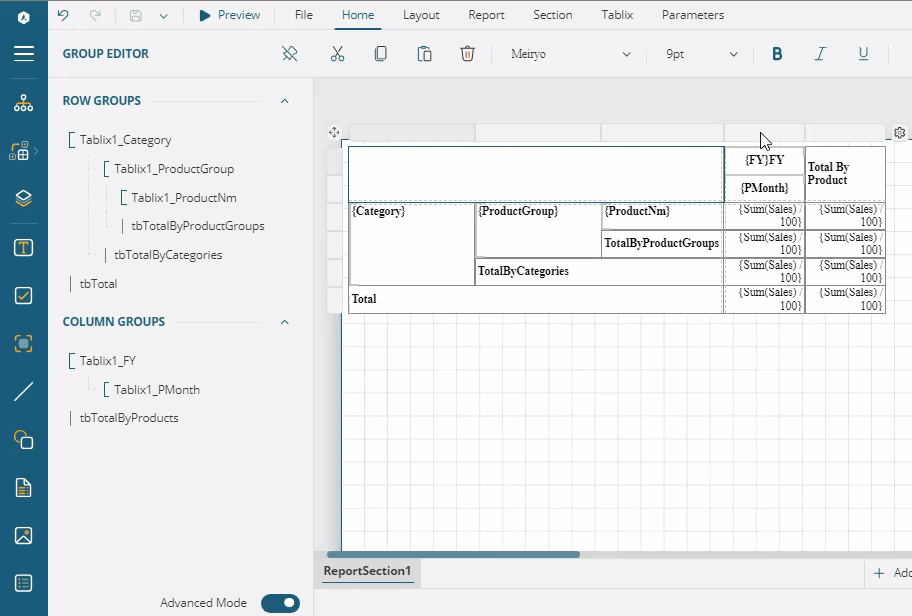
Enhanced Visualization with Advanced Tablix Group Editor
The Tablix Group Editor in ActiveReports.NET 18 has been improved to enhance how users interact with and visualize the hierarchy of group members. When selecting single or multiple rows, columns, or cells within the Tablix body, the editor automatically highlights the corresponding hierarchy, making it easier to understand and manage group relationships.
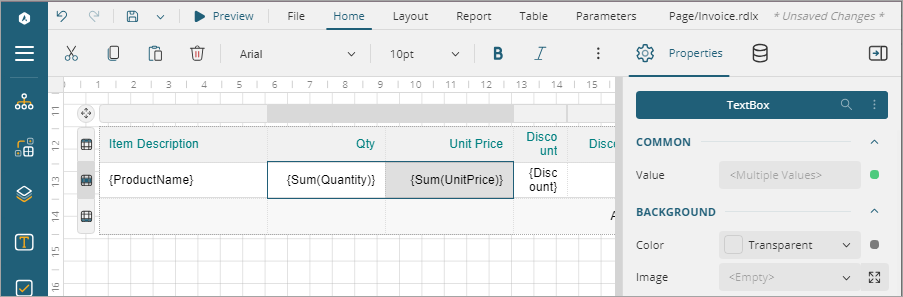
Simultaneous TextBox Updates
ActiveReports.NET’s Web Report Designer now supports simultaneous updates to multiple TextBoxes through the "Current Textbox Value" option in the Expression Editor. This enhancement simplifies the process of applying uniform expressions, significantly improving efficiency and consistency in report design.
RDL Multi-Section and RDL Merged
This change simplifies the report design process by merging RDL (Report Definition Language) multi-section reports with standard RDL reports. All RDL reports will now have optional multi-section functionality instead of having two different options.
Section Report Web Designer Improvements
Enhancements to the web designer for section reports improve usability and functionality, allowing users to design and customize their reports more efficiently and intuitively in a web environment.
- Group Header/Footer Names in Report Explorer: This feature adds the ability to name group headers and footers in the Report Explorer. It improves report organization and makes navigating complex reports with multiple grouping levels easier
- Set Rounding Radius Using Mouse: Users can now adjust the rounding radius of corners directly using the mouse, offering a more intuitive and precise way to style report elements
- Added Clear Borders to Separate Report/Page/Group/Detail Sections: Clear borders have been introduced to visually separate different sections within the report designer. This visual cue helps users quickly distinguish between report, page, group, and detail sections, enhancing the report design process
- Added Event Box in Script Tab: Adding an event box in the script tab allows users to write and manage custom code for report events more easily. This feature enhances customizability and interactivity within reports
- Added InputFieldText and InputFieldCheckBox: These new controls allow users to incorporate text input fields and checkboxes directly into their reports, facilitating interactive and dynamic report designs that can capture user input
- SVG Support in Picture Control: With SVG support in the picture control for section reports, users can now incorporate scalable vector graphics, ensuring high-quality images that are resolution-independent
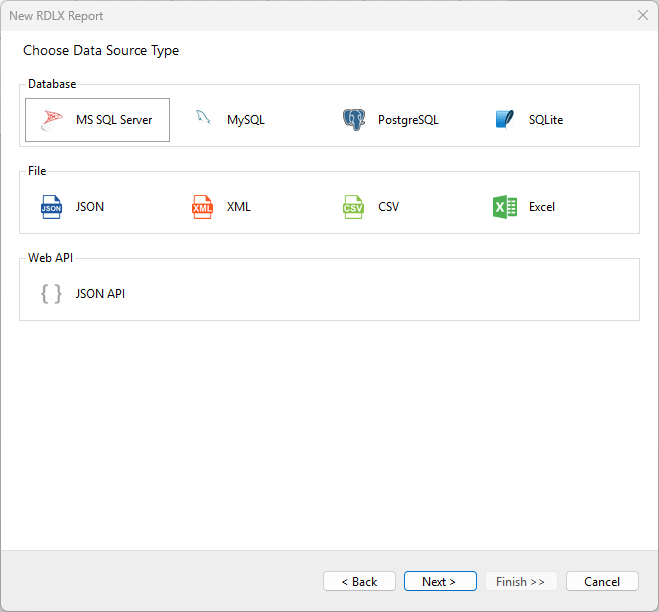
Expanded Data Source Support for Page/RDLX Reports
In our ongoing effort to enhance data connectivity and flexibility within ActiveReports.NET, we are excited to announce the addition of support for several new built-in data sources. Report authors can now connect their RDLX, Page, and Dashboard reports directly to:
- MySQL: Tap into the power of one of the world's most popular open-source relational database management systems
- PostgreSQL: Leverage this advanced, enterprise-class open-source database system known for its reliability and robustness
- Excel: Directly import data from Excel files, allowing for seamless integration of spreadsheet data into your reports
Format Property for DateTime Parameters
This new property allows users to specify the display format for DateTime parameters, providing greater control over how date and time data is presented in reports.
Enhanced Navigation with Tab Order for Editable Fields in PDF
ActiveReports.NET 18 introduces the ability to precisely control the tab order of editable fields in PDF forms through a new TabIndex property on InputField controls. This addition allows for the customization of navigation, enabling users to set a specific sequence for moving from one field to another using the Tab key. This feature enhances form usability and improves the overall user experience in PDF documents.
InputField (Page/RDLX Report) | InputField (Section Report) | InputFieldCheckBox (Section Report)
Improved ASP.NET Middleware for ActiveReports.NET Web Integration
We've enhanced the ASP.NET middleware in ActiveReports.NET 18, streamlining the integration of ActiveReports.NET Web components for developers. This improvement simplifies the process of embedding reporting capabilities into web applications, ensuring a smoother, more efficient development experience.
WebDesigner Application | Js Viewer Application | Blazor Viewer Application
Shift+Scroll Wheel to Scroll Horizontally in Windows Designer and Preview
This enhancement improves navigation within the Windows Designer and Preview mode, making it more convenient to scroll content with horizontal scroll bars.
Added API to Specify Printer Name When the Print Button is Clicked in the Viewer
This API enhancement allows developers to programmatically specify the printer when the print button is used in the viewer, offering more control over the printing process and enhancing the end-user experience by streamlining print operations.
To find a list of any breaking changes from ActiveReports.NET 17 to ActiveReports.NET 18, please check this documentation article.
As always, if you have any positive or negative feedback or if there’s anything you’d like to see in a future version of ActiveReports.NET, please let us know!
ActiveReports.NET v18 is ready for you! Download a 30-day Free Trial Today!
AR 18.0.1 Patch Notes
- AR-33474 – Fixed an issue where a JsonException occurred when deserializing a report snapshot if JSON depth exceeded 64
- AR-33393 – Fixed an issue where setting Visibility of a Container control to Hidden prevented the Visibility of controls inside the Container from being changed
- AR-33426 – Fixed an issue preventing custom themes from being used in the Blazor WebDesigner