
- Introduction
- Report Readers
- Report Authors
- DevOps
-
Developers
- Quick Start
- Breaking Changes
- ActiveReports Version Compatibility and Migration
- License ActiveReports
- Configure ActiveReports Using Code
-
Work with Reports using Code
- Visual Studio Integrated Designer
- Page/RDLX Report
-
Section Report
- Create a Report or Load an Existing Report
- Bind a Section Report to Data
- Save Section Reports
- Change Ruler Measurements
- Modify Printer Settings
- Insert or Add Report Pages
- Save and Load RDF Files
- Work with Subreports
- Draw on the Canvas of Rendered Report
- Work with Code-based Section Reports
- Optimize Section Reports
- Custom Properties in Chart
- Report Parts
- Create Designer and Viewer Applications
- Extensibility in ActiveReports
- External Customizations in ActiveReports
- Export Reports
- Print Reports
- Plugins Development
- Samples
- Troubleshooting
Draw on the Canvas of Rendered Report
At times, you may want some graphics (such as shapes, text, or images) to be rendered on top of your report, just like an overlay. A simple scenario is showing a warning about a limited or expired version of your application on top of the rendered report.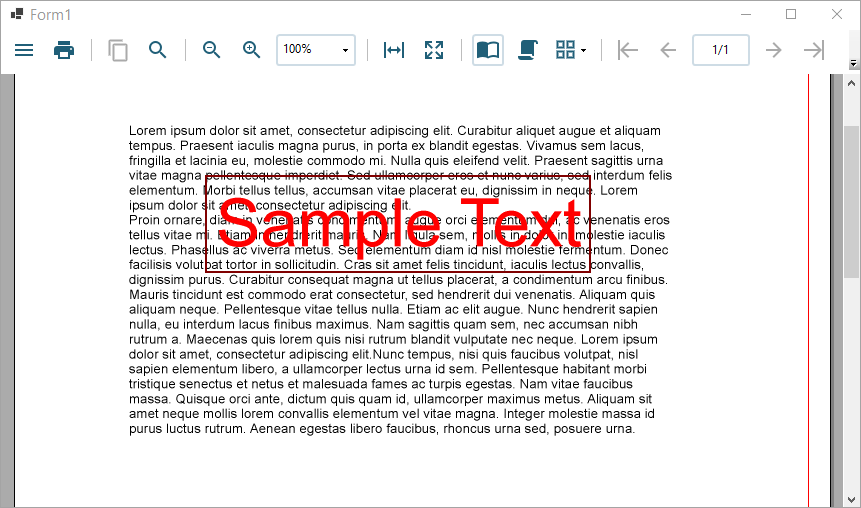
The following sample code demonstrates drawing a rectangular shape with the DrawRect() method and drawing a text with the DrawText() on a section report. Note that these methods must be called after the report.Run(), since you are drawing on the canvas of a rendered report.
var report = new SectionReport();
report.LoadLayout(XmlReader.Create(Application.StartupPath + "\\Report.rpx"));
report.Run();
report.Document.Pages[0].PenWidth = 3;
report.Document.Pages[0].ForeColor = Color.Maroon;
report.Document.Pages[0].DrawRect(2, 2, 4, 1);
report.Document.Pages[0].Font = new GrapeCity.ActiveReports.Document.Drawing.Font("Arial", 50);
report.Document.Pages[0].ForeColor=Color.Red;
report.Document.Pages[0].DrawText("Sample Text",2.1f, 2.1f,4 , 1f);
viewer1.LoadDocument(report.Document);