
- Introduction
- Report Readers
- Report Authors
- DevOps
-
Developers
- Quick Start
- Breaking Changes
- ActiveReports Version Compatibility and Migration
- License ActiveReports
- Configure ActiveReports Using Code
- Work with Reports using Code
- Report Parts
-
Create Designer and Viewer Applications
- .NET Viewer Application
- Web Viewer and Web Designer Middlewares
-
Js Viewer Application
- ASP.NET MVC Core Integration
- Integration to Angular Application
- Integration to React Application
- Integration to VueJS Application
- Load Reports
- Configuring Render Formats
- Update Security Token in Report Service
- Caching Reports
- Prevent Cross-Site Scripting Attacks
- Customize UI
- Customize Page View
- Animation
- View Reports from Different Domains using CORS
- Predefined Export Settings
- Js Viewer API
- Customizing Report Items Appearance
- ASP.NET WebViewer Application
- Blazor Viewer Application
- WebDesigner Application
- Blazor WebDesigner Application
- End User Report Designer in WinForms Application
- Themes in WebDesigner and Js Viewer Components
- Role Based Authorization with JWT
- Extensibility in ActiveReports
- External Customizations in ActiveReports
- Export Reports
- Print Reports
- Plugins Development
- Samples
- Troubleshooting
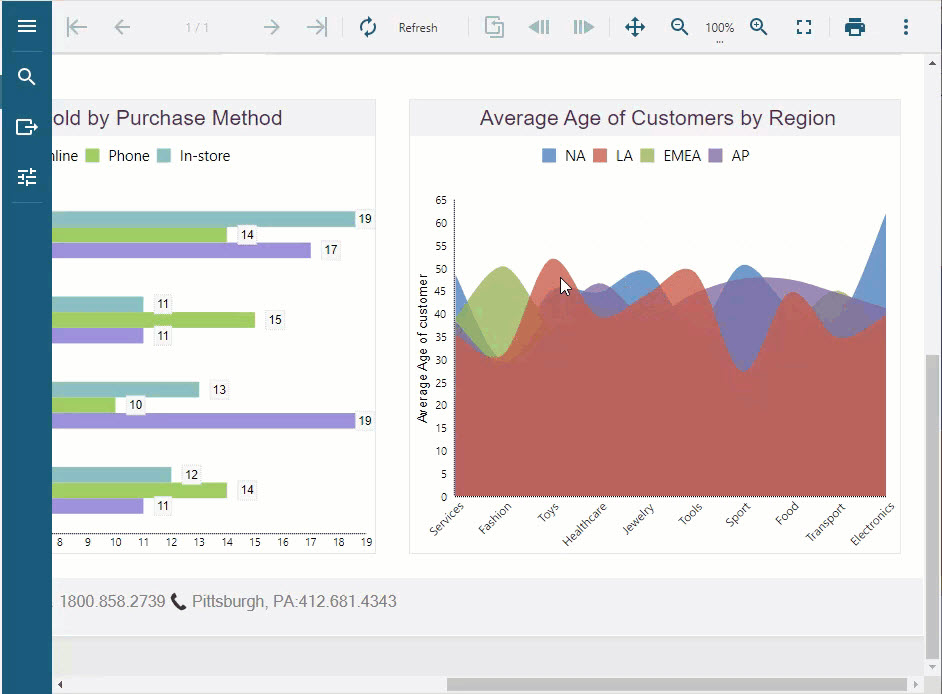
Animation
The Js Viewer (and WebViewer control) provides the API for users to add animations to charts and tables. You can enable the animation feature on charts when the chart is loaded and when the user hovers over a chart or a table.
type=note
Note: For the chart animations, you need to add the jsViewer.chart.min.js and jsVIewer.chart.min.css files from the NPM packages to your project and link them on your page.
Load Animation on Charts
Load animation occurs when the chart first loads, or when the chart is forced to reload. To enable load animation in charts, use the following code:
animation: {
    loadChart: {
        enabled: true
               }
           }
Hover Animation
Hover animation occurs when the user hovers the mouse over a data point.
Hover Animation on Charts
The hover animation in the case of charts scales the data point. The data point is enlarged when the user hovers the mouse over the data and is shrunk back to the original size when the user hovers away from the data point. Depending on the Tooltip template set on the chart while designing a chart, the hover labels can also be displayed over the data points.
animation: {
    hoverChart: {
        enabled: true
                },
           }
Hover Animation on Tables
The hover animation in the case of tables highlights the table row by coloring the row background and the text on the hover.
animation: {
    hoverTable: {
        enabled: true,
        backgroundColor: 'LightGray',
        textColor: 'DarkGray'
                }
            }
Complete Code Implementation
The complete working code is provided below for implementing the chart load, and the chart and table hover animations.
<!DOCTYPE html>
<html lang="en">
<head>
    <meta charset="utf-8">
    <link rel='shortcut icon' type='image/x-icon' href='favicon.ico' />
    <meta name="viewport" content="width=device-width, initial-scale=1, shrink-to-fit=no">
    <meta name="theme-color" content="#000000">
    <title>JS Viewer</title>
    <link href="jsViewer.min.css" rel="stylesheet">
    <link href="jsViewer.chart.min.css" rel="stylesheet" />
    <link href="index.css" rel="stylesheet">
</head>
<body onload="loadViewer()">
    <div style="width: 100%">
        <div id="viewerContainer"></div>
    </div>
    <script type="text/javascript" src="jsViewer.min.js"></script>
    <script type="text/javascript" src="jsViewer.chart.min.js"></script>
    <script type="text/javascript">
        let viewer;
        function loadViewer() {
            viewer = GrapeCity.ActiveReports.JSViewer.create({
                element: '#viewerContainer',
                displayMode: "Continuous",
                pageView: {
                    horizontalAlignment: "center",
                    viewMode: "standard" // default : noPaper
                },
                animation: {
                    hoverTable: {
                        enabled: true,
                        backgroundColor: 'LightGray',
                        textColor: 'DarkGray'
                    },
                    loadChart: {
                        enabled: true
                    },
                    hoverChart: {
                        enabled: true
                    }
                }
            });

            console.dir(viewer)
            viewer.openReport("DemoReport.rdlx");
        }
    </script>
</body>
</html>