
- Spread for WPF Overview
- Key Features
- Getting Started
- Quick Start
- Designer
- Features
- Assembly Reference
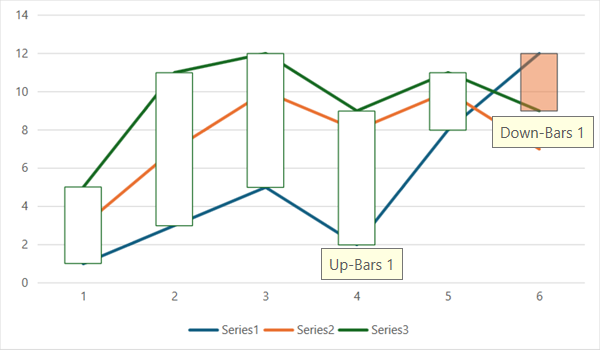
Up-Down Bar
Up-down bars are useful in line charts with multiple data series. It is primarily used to highlight the difference between two data points in the first data series and the last data series.
You can set the ShowUpDownBars property of the IChartGroup interface to true to display the up and down bars in a line chart. Use the DownBars property and UpBars property to customize the styles of the bars as per your preferences.
!type=note
Note: Up-Down bars are available for Line charts only.
Refer to the following example code to configure the up-down bars for the line chart as per your preferences.
C#
object[,] values = new object[,] { { 1, 3, 5, 2, 8, 12 }, { 2, 4, 5, 6, 2, -5 }, { 2, 4, 2, 1, 1, 2 }, { 0, 4, 2, 1, 0, 2 }, { 1, 3, 5, 0, 8, 12 } };
var sheet1 = spreadSheet1.Workbook.ActiveSheet;
sheet1.SetValue(0, 0, values, false);
sheet1.Cells["A1:F3"].Select();
sheet1.Shapes.AddChart(GrapeCity.Spreadsheet.Charts.ChartType.LineStacked, 100, 50, 600, 350, false);
// Show up-down bars.
sheet1.ChartObjects[0].Chart.ChartGroups[0].ShowUpDownBars = true;
sheet1.ChartObjects[0].Chart.ChartGroups[0].UpBars.Format.Line.BackColor.ObjectThemeColor = GrapeCity.Core.SchemeThemeColors.Accent3;
sheet1.ChartObjects[0].Chart.ChartGroups[0].DownBars.Format.Fill.ForeColor.ObjectThemeColor = GrapeCity.Core.SchemeThemeColors.Accent2;
sheet1.ChartObjects[0].Chart.ChartGroups[0].DownBars.Format.Fill.Transparency = 0.5;
VB
Dim values = New Object(,) {
    {1, 3, 5, 2, 8, 12},
    {2, 4, 5, 6, 2, -5},
    {2, 4, 2, 1, 1, 2},
    {0, 4, 2, 1, 0, 2},
    {1, 3, 5, 0, 8, 12}}
Dim sheet1 = spreadSheet1.Workbook.ActiveSheet
sheet1.SetValue(0, 0, values, False)
sheet1.Cells("A1:F3").[Select](/spreadnet/docs/latest/online-wpf/spreadwpffeatures/charts/chart-elements/up-down-bar)
sheet1.Shapes.AddChart(GrapeCity.Spreadsheet.Charts.ChartType.LineStacked, 100, 50, 600, 350, False)
' Show up-down bars.
sheet1.ChartObjects(0).Chart.ChartGroups(0).ShowUpDownBars = True
sheet1.ChartObjects(0).Chart.ChartGroups(0).UpBars.Format.Line.BackColor.ObjectThemeColor = GrapeCity.Core.SchemeThemeColors.Accent3
sheet1.ChartObjects(0).Chart.ChartGroups(0).DownBars.Format.Fill.ForeColor.ObjectThemeColor = GrapeCity.Core.SchemeThemeColors.Accent2
sheet1.ChartObjects(0).Chart.ChartGroups(0).DownBars.Format.Fill.Transparency = 0.5