
- Spread for WPF Overview
- About the Product
- Getting Started
- Quick Start
- Designer
- Features
- Assembly Reference
Legend
A legend entry in a chart refers to the name of the data category plotted on the chart. The primary objective of adding legends to a chart is to help readers understand the plotted information and analyze the data. You can define legends in charts to show descriptions of the data contained in the rows and columns of a worksheet.
To configure chart legends, use the Legend property of the IChart interface. Additionally, use the properties of the ILegend interface to edit chart legends' display status, position, alignment, etc. For example, setting the IncludeInLayout property to true or false allows you to determine whether the legend is shown or hidden in the chart. The default value for this property is true.
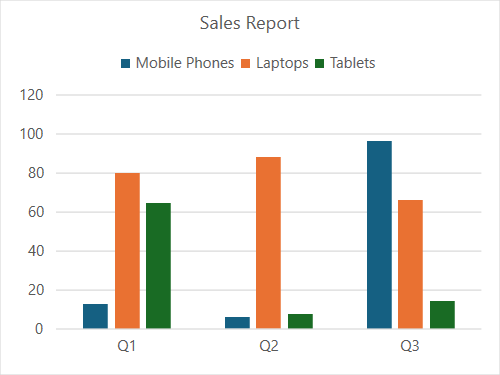
The following example code customizes the legends’ position at the top of the chart and included in the layout for better visibility.
C#
spreadSheet1.Workbook.ActiveSheet.Cells[0, 1].Value = "Q1";
spreadSheet1.Workbook.ActiveSheet.Cells[0, 2].Value = "Q2";
spreadSheet1.Workbook.ActiveSheet.Cells[0, 3].Value = "Q3";
spreadSheet1.Workbook.ActiveSheet.Cells[1, 0].Value = "Mobile Phones";
spreadSheet1.Workbook.ActiveSheet.Cells[2, 0].Value = "Laptops";
spreadSheet1.Workbook.ActiveSheet.Cells[3, 0].Value = "Tablets";
for (var r = 1; r <= 3; r++)
{
     for (var c = 1; c <= 3; c++)
     {
        Random random = new Random();
        spreadSheet1.Workbook.ActiveSheet.Cells[r, c].Value = 0 + random.Next(0, 100);
     }
}
spreadSheet1.Workbook.ActiveSheet.Cells["A1:D4"].Select();
spreadSheet1.Workbook.ActiveSheet.Shapes.AddChart(GrapeCity.Spreadsheet.Charts.ChartType.ColumnClustered, 100, 150, 400, 300, true);
spreadSheet1.Workbook.ActiveSheet.ChartObjects[0].Chart.ChartTitle.Text = "Sales Report";
var legend = spreadSheet1.Workbook.ActiveSheet.ChartObjects[0].Chart.Legend;
legend.Position = LegendPosition.Top;
legend.IncludeInLayout = true;
VB
spreadSheet1.Workbook.ActiveSheet.Cells(0, 1).Value = "Q1"
spreadSheet1.Workbook.ActiveSheet.Cells(0, 2).Value = "Q2"
spreadSheet1.Workbook.ActiveSheet.Cells(0, 3).Value = "Q3"
spreadSheet1.Workbook.ActiveSheet.Cells(1, 0).Value = "Mobile Phones"
spreadSheet1.Workbook.ActiveSheet.Cells(2, 0).Value = "Laptops"
spreadSheet1.Workbook.ActiveSheet.Cells(3, 0).Value = "Tablets"
For r = 1 To 3
        For c = 1 To 3
            Dim random As Random = New Random()
            spreadSheet1.Workbook.ActiveSheet.Cells(r, c).Value = 0 + random.Next(0, 100)
        Next
Next
spreadSheet1.Workbook.ActiveSheet.Cells("A1:D4").Select()
spreadSheet1.Workbook.ActiveSheet.Shapes.AddChart(GrapeCity.Spreadsheet.Charts.ChartType.ColumnClustered, 100, 150, 400, 300, True)
spreadSheet1.Workbook.ActiveSheet.ChartObjects(0).Chart.ChartTitle.Text = "Sales Report"
Dim legend = spreadSheet1.Workbook.ActiveSheet.ChartObjects(0).Chart.Legend
legend.Position = LegendPosition.Top
legend.IncludeInLayout = True