
- Spread for WPF Overview
- About the Product
- Getting Started
- Quick Start
- Designer
- Features
- Assembly Reference
Table
The data presented in tabular format is easy to read, understand, visualize, and organize. When you create a table from a range of cells, it becomes easier to manage and analyze related data. You can also bind external data to tables.
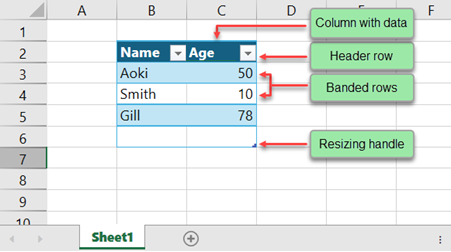
You can manage the data in the table's rows and columns independently from the data in other rows and columns on the sheet. Usually, a table contains a header row, banded rows, calculated columns, a total row, and a resizing handle.
While working with tables, you can also select individual rows, columns, or the entire table. For example, you can select a table column by clicking the top edge of its header or select a row by clicking the left edge of its header. To select the entire table, click the top left corner. A single click selects the rows and columns, while a double-click selects the table header.
Create Tables
You can create tables in worksheets by using the CreateTable method of the IRange interface. To add data to the table cells, use the Text and Value properties of the IRange interface.
Refer to the following example code to create tables in a worksheet.
C#
// Add data.
spreadSheet1.Workbook.Worksheets[0].Cells[1, 1].Text = "Name";
spreadSheet1.Workbook.Worksheets[0].Cells[1, 2].Text = "Age";
spreadSheet1.Workbook.Worksheets[0].Cells[2, 1].Text = "Aoki";
spreadSheet1.Workbook.Worksheets[0].Cells[2, 2].Value = 50;
spreadSheet1.Workbook.Worksheets[0].Cells[3, 1].Text = "Smith";
spreadSheet1.Workbook.Worksheets[0].Cells[3, 2].Value = 10;
spreadSheet1.Workbook.Worksheets[0].Cells[4, 1].Text = "Gill";
spreadSheet1.Workbook.Worksheets[0].Cells[4, 2].Value = 78;
// Create a table.
spreadSheet1.Workbook.Worksheets[0].Cells["B2:C6"].CreateTable(true, "CustomerTable", null);
ITable table = spreadSheet1.Workbook.Worksheets[0].Tables["CustomerTable"];
VB
' Add data.
spreadSheet1.Workbook.Worksheets(0).Cells(1, 1).Text = "Name"
spreadSheet1.Workbook.Worksheets(0).Cells(1, 2).Text = "Value"
spreadSheet1.Workbook.Worksheets(0).Cells(2, 1).Text = "Aoki"
spreadSheet1.Workbook.Worksheets(0).Cells(2, 2).Value = 50
spreadSheet1.Workbook.Worksheets(0).Cells(3, 1).Text = "Smith"
spreadSheet1.Workbook.Worksheets(0).Cells(3, 2).Value = 10
spreadSheet1.Workbook.Worksheets(0).Cells(4, 1).Text = "Gill"
spreadSheet1.Workbook.Worksheets(0).Cells(4, 2).Value = 78
' Create a table.
spreadSheet1.Workbook.Worksheets(0).Cells("B2:C6").CreateTable(True, "CustomerTable", Nothing)
Dim table As ITable = spreadSheet1.Workbook.Worksheets(0).Tables("CustomerTable")
Add and Delete Columns/Rows
You can add and delete columns and rows of a table using the methods and properties of the following interfaces:
ITableColumns - Represents the collection of columns in a table.
ITableRows - Represents the collection of rows in a table.
ITableColumn - Represents an individual column in a table.
ITableRow - Represents an individual row in a table.
To insert columns, use the Add method of the ITableColumns interface, and the Delete method of the ITableColumn interface to delete unnecessary columns.
Refer to the following example code to add and delete columns.
C#
// Add a column before the first column.
table.TableColumns.Add(0);
// Delete the second column.
table.TableColumns[1].Delete();
VB
' Add a column before the first column.
table.TableColumns.Add(0)
' Delete the second column.
table.TableColumns(1).Delete()
Additionally, to insert rows, use the Add method of the ITableRows interface and the Delete method of the ITableRow interface to delete unnecessary rows.
Refer to the following example code to add and delete rows.
C#
// Add a row before the second row.
table.TableRows.Add(1);
// Delete the second row.
table.TableRows[2].Delete();
VB
' Add a row before the second row.
table.TableRows.Add(1)
' Delete the second row.
table.TableRows(2).Delete()
Resize Table
You can resize a table by changing the number of rows and columns. To resize a table at runtime, use the resizing handle located at the bottom-right corner of the table. Hover your cursor on it until it becomes a double-headed arrow, then drag the table border to the right to add columns or down to add rows. A table can also be resized by using the Resize method of ITable interface. This method resizes the boundary of the table over a new range by adjusting rows and columns.
Refer to the following example code shows how to resize a table using the Resize method.
C#
// Resize the table.
table.Resize(1, 3, -1);
VB
' Resize the table.
table.Resize(1, 3, -1);
Filter Table Data
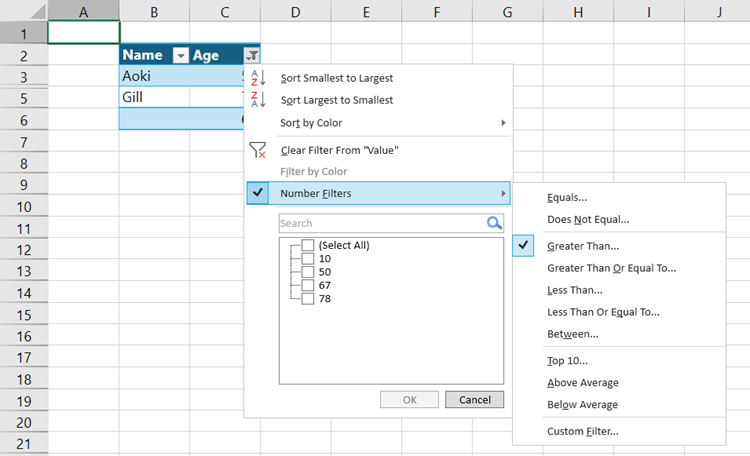
You can filter table data based on values in the table. You can use code or click the dropdown icon in the header row to apply the filter. The following image shows the dropdown menu that displays the text filters.
When applying filters on tables in a worksheet, you need to first get the table range and then use the AutoFilter method of the IRange interface to filter the table data. Then, use the ApplyFilter method if you want to reapply the filter after changing a cell value.
Refer to the following example code to set table filters in a worksheet.
C#
// Apply the filter to the table.
table.Range.AutoFilter(1, ">10", AutoFilterOperator.And);
// Use ApplyFilter method when you change a cell value and want to reapply the filter.
spreadSheet1.Workbook.Worksheets[0].Cells[5, 2].Value = 67;
table.AutoFilter.ApplyFilter();
VB
' Apply the filter to the table.
table.Range.AutoFilter(1, ">10", AutoFilterOperator.[And])
' Use ApplyFilter method when you change a cell value and want to reapply the filter.
spreadSheet1.Workbook.Worksheets(0).Cells(5, 2).Value = 67
table.AutoFilter.ApplyFilter()
Sort Table Data
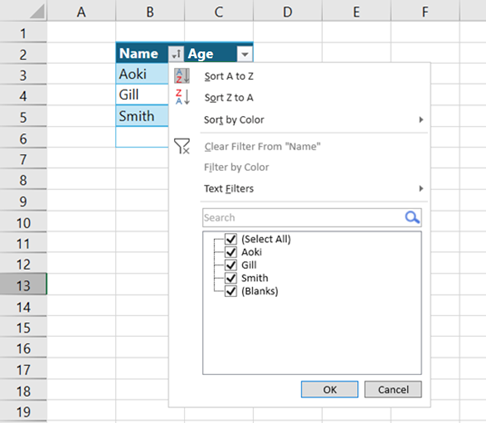
You can sort the data present in a table in ascending or descending order based on the values in a column. Sorting can also be done on one or more columns. You can use the arrow on the table's column header to select the required sorting criteria or you can use the Sort property of the ITable interface and the Apply method to apply the selected sort state and display the results.
Refer to the following example code to apply table sorting in a worksheet.
C#
// Sort the table data.
table.Sort.SortFields.Add(0, SortOn.Value, SortOrder.Ascending);
table.Sort.Apply();
VB
' Sort the table data.
table.Sort.SortFields.Add(0, SortOn.Value, SortOrder.Ascending)
table.Sort.Apply()
Move Table Columns/Rows
You can move table columns or rows to another position using the Move method of ITableColumns or ITableRows interface.
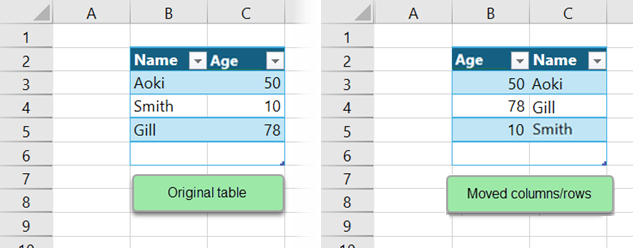
The following example code moves the columns and rows of a table to a new position in the worksheet.
C#
// Move the table columns.
table.TableColumns.Move(0, 2, 1);
// Move the table row.
table.TableRows.Move(1, 3, 1);
VB
' Move the table columns.
table.TableColumns.Move(0, 2, 1)
' Move the table row.
table.TableRows.Move(1, 3, 1)
Add Formulas to Tables
You can add formulas to the table's total row at runtime with the dropdown arrow or using the code. To add total row in a table, use the ShowTotals property of the ITable interface. By default, total row calculates the sum of the column values. However, you can apply different mathematical functions in the total row, such as count, average, max, min, etc. using the dropdown arrow displayed next to the row cell.
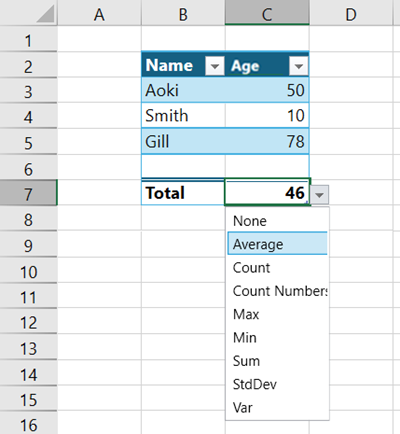
The following example shows how to set up a formula in the total row to calculate the average.
C#
// Show a total row in the table.
// The row has a dropdown that displays the table formula.
table.ShowTotals = true;
table.TableColumns[1].TotalsCalculation = TotalsCalculation.Average;
VB
' Show a total row in the table.
' The row has a dropdown that displays the table formula.
table.ShowTotals = True
table.TableColumns(1).TotalsCalculation = TotalsCalculation.Average