
Filter
Spread for WPF allows users to apply filters (Number filters, Text filters, Date filters, Color filters, Font Color filter, Icon filters) based on the data type of the cells. This feature displays only the relevant data in the worksheet (based on the specified filter condition) while hiding unnecessary data.
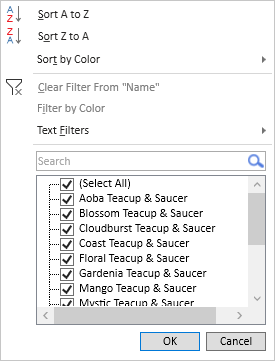
You can apply multiple filters to the data and also clear filters when you need to view the entire dataset. A filter button is displayed in the column header for a column that allows filtering. The user can click on the button and use the available options in the Filter dialog.
Filter by Column
When working with large worksheets, applying filters to columns can streamline data analysis. Column filtering allows you to define specific conditions to display only the relevant rows while hiding data that does not meet the specified criteria.
To apply column filters in a worksheet, use the AutoFilter method of the IRange interface. Additionally, you can set filter conditions by specifying values from the DynamicFilterType enumeration, such as AboveAverage, BelowAverage, Tomorrow, LastMonth, ThisYear, YearToDate, and others.
The following GIF demonstrates filtering a sales report to hide irrelevant data, enhancing clarity and reducing confusion.
Refer to the following example code to enable filtering in the worksheet.
C#
// Enable filtering on the sheet. Appears a filter button on the column headers.
spreadSheet1.Workbook.Worksheets[0].Columns[0, 3].AutoFilter(true);
VB
' Enable filtering on the sheet. Appears a filter button on the column headers.
spreadSheet1.Workbook.Worksheets(0).Columns(0, 3).AutoFilter(True)
Filter by Multiple Columns
You can apply multiple filter criteria on the multiple columns in the datasets to streamline the data for better understanding. Only the rows that satisfy all or specific combinations of these criteria remain visible or are selected, while others are hidden or ignored.
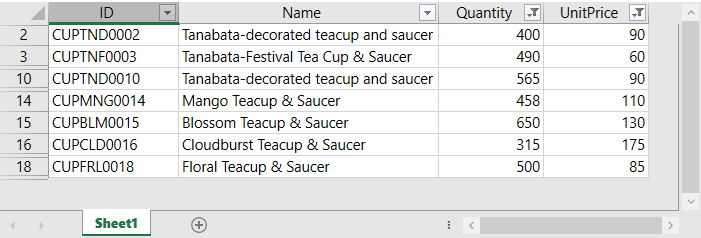
The following image illustrates the multiple filter conditions applied on the multiple columns in the sales data report.
Refer to the following example code to apply multiple filter conditions on the multiple columns.
C#
// Apply filter conditions on multiple columns.
spreadSheet1.Workbook.Worksheets[0].Columns.AutoFilter(3, GrapeCity.Spreadsheet.DynamicFilterType.BelowAverage);
spreadSheet1.Workbook.Worksheets[0].Columns.AutoFilter(2, GrapeCity.Spreadsheet.DynamicFilterType.AboveAverage);
VB
' Apply filter conditions on multiple columns.
spreadSheet1.Workbook.Worksheets(0).Columns.AutoFilter(3, GrapeCity.Spreadsheet.DynamicFilterType.BelowAverage)
spreadSheet1.Workbook.Worksheets(0).Columns.AutoFilter(2, GrapeCity.Spreadsheet.DynamicFilterType.AboveAverage)
Clear Filter
You can clear all filter conditions applied to one or multiple columns at once by using the ShowAllData method of the IAutoFilter interface.
The following GIF illustrates how to clear filter conditions applied to multiple columns simultaneously.
![]()
Refer to the following example code to clear all filter conditions from multiple columns.
C#
// Clear filter.
spreadSheet1.Workbook.ActiveSheet.AutoFilter.ShowAllData();
VB
' Clear filter.
spreadSheet1.Workbook.ActiveSheet.AutoFilter.ShowAllData()