
- Spread for WPF Overview
- About the Product
- Getting Started
- Quick Start
- Designer
- Features
- Assembly Reference
Walls
The walls refer to the back and side walls of a 3D chart.
Spread for WPF allows you to customize these walls by modifying their thickness, fill color, and formatting. You can configure both the back and side walls together or individually as per your requirements. To configure chart walls, you need to use the properties of IWalls interface and IChart interface.
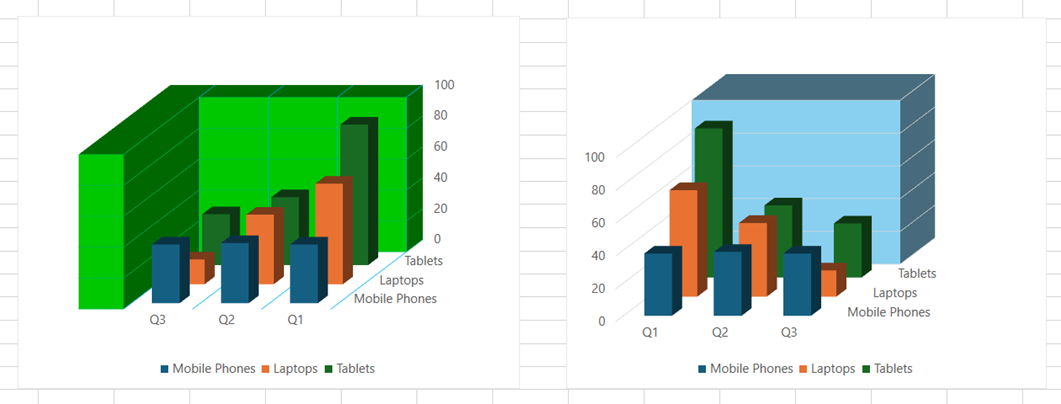
The following example code configures the walls of the chart in the activesheet.
C#
// Add data.
spreadSheet1.Workbook.ActiveSheet.Cells[0, 1].Value = "Q1";
spreadSheet1.Workbook.ActiveSheet.Cells[0, 2].Value = "Q2";
spreadSheet1.Workbook.ActiveSheet.Cells[0, 3].Value = "Q3";
spreadSheet1.Workbook.ActiveSheet.Cells[1, 0].Value = "Mobile Phones";
spreadSheet1.Workbook.ActiveSheet.Cells[2, 0].Value = "Laptops";
spreadSheet1.Workbook.ActiveSheet.Cells[3, 0].Value = "Tablets";
for (var r = 1; r <= 3; r++)
{
    for (var c = 1; c <= 3; c++)
    {
        Random random = new Random();
        spreadSheet1.Workbook.ActiveSheet.Cells[r, c].Value = random.Next(0, 100);
    }
}
spreadSheet1.Workbook.ActiveSheet.Cells["A1:D4"].Select();
spreadSheet1.Workbook.ActiveSheet.Shapes.AddChart(GrapeCity.Spreadsheet.Charts.ChartType.Column3D, 100, 150, 400, 300, true);

// Config back wall and side wall's format together.
var chart = spreadSheet1.Workbook.ActiveSheet.ChartObjects[0].Chart;
chart.Walls.Thickness = 30;
chart.Walls.Format.Fill.ForeColor.ObjectThemeColor = GrapeCity.Core.SchemeThemeColors.Accent3;
chart.Axes[AxisType.Category].ReversePlotOrder = true;
chart.Axes[AxisType.Value].MajorGridlines.Format.Line.ForeColor.ObjectThemeColor = GrapeCity.Core.SchemeThemeColors.Accent2;
chart.Axes[AxisType.Category].HasMajorGridlines = true;
chart.Axes[AxisType.Category].MajorGridlines.Format.Line.ForeColor.ObjectThemeColor = GrapeCity.Core.SchemeThemeColors.Accent1;

// Config back wall's format individually.
spreadSheet1.Workbook.ActiveSheet.Shapes.AddChart(GrapeCity.Spreadsheet.Charts.ChartType.Column3D, 600, 150, 400, 300, true);
var chart1 = spreadSheet1.Workbook.ActiveSheet.ChartObjects[1].Chart;
chart1.BackWall.Thickness = 60;
chart1.BackWall.Format.Fill.ForeColor.ObjectThemeColor = GrapeCity.Core.SchemeThemeColors.Accent2;
chart1.Axes[AxisType.Value].TickLabelPosition = TickLabelPosition.NextTo;
VB
' Add data.
spreadSheet1.Workbook.ActiveSheet.Cells(0, 1).Value = "Q1"
spreadSheet1.Workbook.ActiveSheet.Cells(0, 2).Value = "Q2"
spreadSheet1.Workbook.ActiveSheet.Cells(0, 3).Value = "Q3"
spreadSheet1.Workbook.ActiveSheet.Cells(1, 0).Value = "Mobile Phones"
spreadSheet1.Workbook.ActiveSheet.Cells(2, 0).Value = "Laptops"
spreadSheet1.Workbook.ActiveSheet.Cells(3, 0).Value = "Tablets"

For r As Integer = 1 To 3
    For c As Integer = 1 To 3
        Dim random As New Random()
        spreadSheet1.Workbook.ActiveSheet.Cells(r, c).Value = random.Next(0, 100)
    Next
Next

spreadSheet1.Workbook.ActiveSheet.Range("A1:D4").Select()
spreadSheet1.Workbook.ActiveSheet.Shapes.AddChart(GrapeCity.Spreadsheet.Charts.ChartType.Column3D, 100, 150, 400, 300, True)

' Config back wall and side wall's format together.
Dim chart = spreadSheet1.Workbook.ActiveSheet.ChartObjects(0).Chart
chart.Walls.Thickness = 30
chart.Walls.Format.Fill.ForeColor.ObjectThemeColor = GrapeCity.Core.SchemeThemeColors.Accent3
chart.Axes(AxisType.Category).ReversePlotOrder = True
chart.Axes(AxisType.Value).MajorGridlines.Format.Line.ForeColor.ObjectThemeColor = GrapeCity.Core.SchemeThemeColors.Accent2
chart.Axes(AxisType.Category).HasMajorGridlines = True
chart.Axes(AxisType.Category).MajorGridlines.Format.Line.ForeColor.ObjectThemeColor = GrapeCity.Core.SchemeThemeColors.Accent1

' Config back wall's format individually.
spreadSheet1.Workbook.ActiveSheet.Shapes.AddChart(GrapeCity.Spreadsheet.Charts.ChartType.Column3D, 600, 150, 400, 300, True)
Dim chart1 = spreadSheet1.Workbook.ActiveSheet.ChartObjects(1).Chart
chart1.BackWall.Thickness = 60
chart1.BackWall.Format.Fill.ForeColor.ObjectThemeColor = GrapeCity.Core.SchemeThemeColors.Accent2
chart1.Axes(AxisType.Value).TickLabelPosition = TickLabelPosition.NextTo