
- Spread for WPF Overview
- About the Product
- Getting Started
- Quick Start
- Designer
- Features
- Assembly Reference
Chart Styles
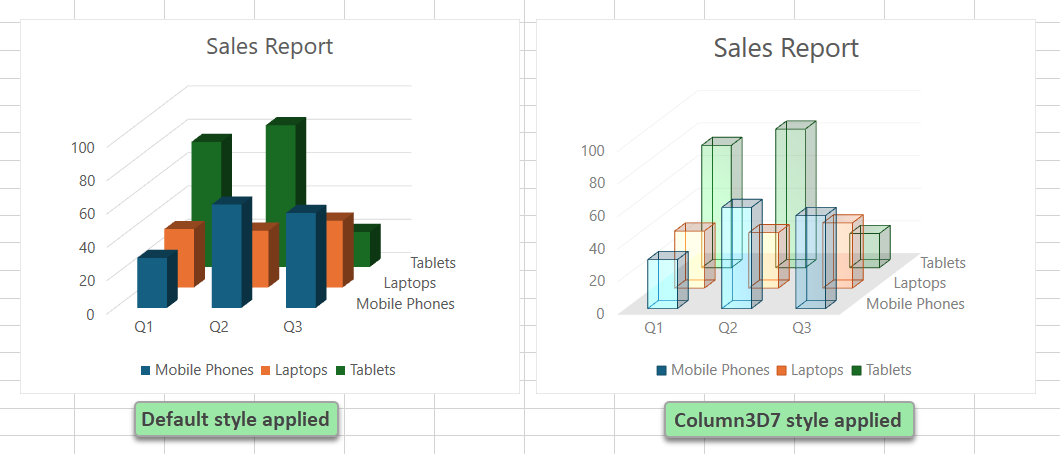
All charts in Spread for WPF come with a default style. However, you can also customize the appearance of the chart by applying a predefined style that meets your requirements. There are a wide range of styles available for different charts.
Note: If no specific style is set, the default style for that particular chart type is automatically applied.
Setting a Chart Style
To apply a predefined style to your chart, you can use the ChartStyle property of the IChart interface. This property returns a value of BuiltInChartStyles enumeration of the GrapeCity.Spreadsheet.Charts namespace.
The following example code adds a column 3D chart to the active sheet and sets its style to Column3D7.
C#
// Add data.
spreadSheet1.Workbook.ActiveSheet.Cells[0, 1].Value = "Q1";
spreadSheet1.Workbook.ActiveSheet.Cells[0, 2].Value = "Q2";
spreadSheet1.Workbook.ActiveSheet.Cells[0, 3].Value = "Q3";
spreadSheet1.Workbook.ActiveSheet.Cells[1, 0].Value = "Mobile Phones";
spreadSheet1.Workbook.ActiveSheet.Cells[2, 0].Value = "Laptops";
spreadSheet1.Workbook.ActiveSheet.Cells[3, 0].Value = "Tablets";
for (var r = 1; r <= 3; r++)
{
    for (var c = 1; c <= 3; c++)
    {
        Random random = new Random();
        spreadSheet1.Workbook.ActiveSheet.Cells[r, c].Value = random.Next(0, 100);
    }
}
spreadSheet1.Workbook.ActiveSheet.Cells["A1:D4"].Select();
// Add Column3D chart.
spreadSheet1.Workbook.ActiveSheet.Shapes.AddChart(GrapeCity.Spreadsheet.Charts.ChartType.Column3D, 100, 150, 400, 300, true);
// Apply chart style.
spreadSheet1.Workbook.ActiveSheet.ChartObjects[0].Chart.ChartStyle = GrapeCity.Spreadsheet.Charts.BuiltInChartStyles.Column3D7;
spreadSheet1.Workbook.ActiveSheet.ChartObjects[0].Chart.ChartTitle.Text = "Sales Report";
VB
' Add data.
spreadSheet1.Workbook.ActiveSheet.Cells(0, 1).Value = "Q1"
spreadSheet1.Workbook.ActiveSheet.Cells(0, 2).Value = "Q2"
spreadSheet1.Workbook.ActiveSheet.Cells(0, 3).Value = "Q3"
spreadSheet1.Workbook.ActiveSheet.Cells(1, 0).Value = "Mobile Phones"
spreadSheet1.Workbook.ActiveSheet.Cells(2, 0).Value = "Laptops"
spreadSheet1.Workbook.ActiveSheet.Cells(3, 0).Value = "Tablets"
Dim random As New Random()
For r As Integer = 1 To 3
    For c As Integer = 1 To 3
        spreadSheet1.Workbook.ActiveSheet.Cells(r, c).Value = random.Next(0, 100)
    Next
Next
spreadSheet1.Workbook.ActiveSheet.Cells("A1:D4").Select()
' Add Column3D chart.
spreadSheet1.Workbook.ActiveSheet.Shapes.AddChart(ChartType.Column3D, 100, 150, 400, 300, True)
' Apply chart style.
spreadSheet1.Workbook.ActiveSheet.ChartObjects(0).Chart.ChartStyle = GrapeCity.Spreadsheet.Charts.BuiltInChartStyles.Column3D7
spreadSheet1.Workbook.ActiveSheet.ChartObjects(0).Chart.ChartTitle.Text = "Sales Report"