
- Spread for WPF Overview
- About the Product
- Getting Started
- Quick Start
- Designer
- Features
- Assembly Reference
Pivot Table
Spread WPF provides users with the ability to display aggregated data in a spreadsheet using pivot tables - a data summarization tool that can perform complex analysis of information stored in cells for exploring, analyzing and manipulating bulk data in a worksheet.
Pivot tables not only help in categorizing data but they also help in computing the totals and average of the values in the cells as per the summary functions defined in the built-in functions list.
The below image shows the Pivot Area in a spreadsheet.
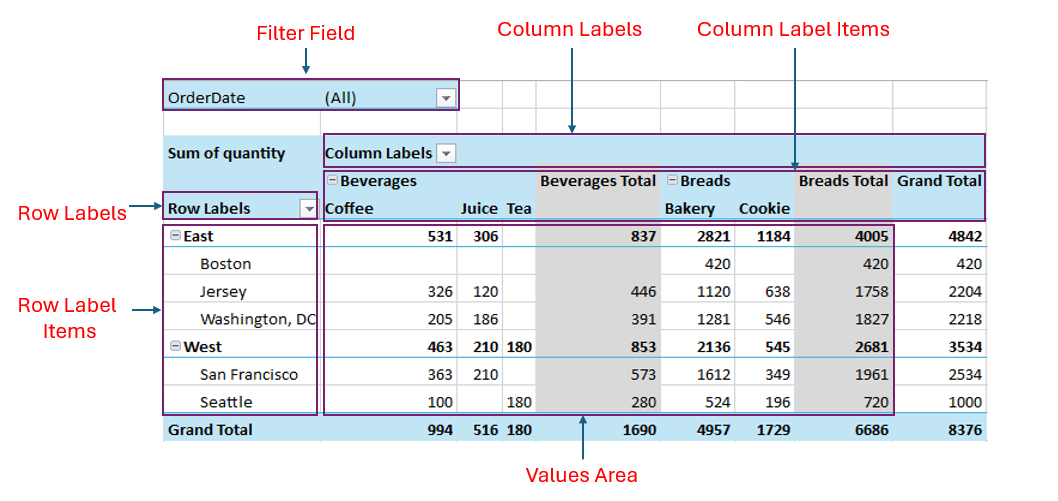
The following table describes the above areas:
Area | Description |
|---|---|
Row Labels | Display the unique values of selected fields as rows, grouping the data. |
Column Labels | Display the unique values of selected fields as columns, grouping the data. |
Filter Field | Allow you to filter the entire pivot table based on the selected field. |
Values Area | Show the summarized data (such as sum, count, average) for the selected fields. |