
- Spread for WPF Overview
- About the Product
- Getting Started
- Quick Start
- Designer
- Features
- Assembly Reference
Chart Area
The chart area refers to the entire region of the chart in the worksheet. It includes all other chart elements, such as title, axes, legend, and plot area. The ChartArea property of the IChart interface is used to customize the chart area.
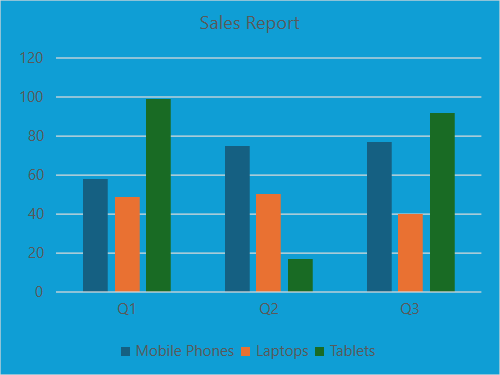
The following example code customizes the background and foreground colors of the chart area.
C#
spreadSheet1.Workbook.ActiveSheet.Cells[0, 1].Value = "Q1";
spreadSheet1.Workbook.ActiveSheet.Cells[0, 2].Value = "Q2";
spreadSheet1.Workbook.ActiveSheet.Cells[0, 3].Value = "Q3";
spreadSheet1.Workbook.ActiveSheet.Cells[1, 0].Value = "Mobile Phones";
spreadSheet1.Workbook.ActiveSheet.Cells[2, 0].Value = "Laptops";
spreadSheet1.Workbook.ActiveSheet.Cells[3, 0].Value = "Tablets";
for (var r = 1; r <= 3; r++)
{
     for (var c = 1; c <= 3; c++)
     {
        Random random = new Random();
        spreadSheet1.Workbook.ActiveSheet.Cells[r, c].Value = 0 + random.Next(0, 100);
     }
}
spreadSheet1.Workbook.ActiveSheet.Cells["A1:D4"].Select();
spreadSheet1.Workbook.ActiveSheet.Shapes.AddChart(GrapeCity.Spreadsheet.Charts.ChartType.ColumnClustered, 100, 150, 400, 300, true);
spreadSheet1.Workbook.ActiveSheet.ChartObjects[0].Chart.ChartTitle.Text = "Sales Report";
var chartArea = spreadSheet1.Workbook.ActiveSheet.ChartObjects[0].Chart.ChartArea;
chartArea.Format.Fill.BackColor.ObjectThemeColor = GrapeCity.Core.SchemeThemeColors.Accent1;
chartArea.Format.Fill.ForeColor.ObjectThemeColor = GrapeCity.Core.SchemeThemeColors.Accent4;
VB
spreadSheet1.Workbook.ActiveSheet.Cells(0, 1).Value = "Q1"
spreadSheet1.Workbook.ActiveSheet.Cells(0, 2).Value = "Q2"
spreadSheet1.Workbook.ActiveSheet.Cells(0, 3).Value = "Q3"
spreadSheet1.Workbook.ActiveSheet.Cells(1, 0).Value = "Mobile Phones"
spreadSheet1.Workbook.ActiveSheet.Cells(2, 0).Value = "Laptops"
spreadSheet1.Workbook.ActiveSheet.Cells(3, 0).Value = "Tablets"
For r = 1 To 3
        For c = 1 To 3
            Dim random As Random = New Random()
            spreadSheet1.Workbook.ActiveSheet.Cells(r, c).Value = 0 + random.Next(0, 100)
        Next
Next
spreadSheet1.Workbook.ActiveSheet.Cells("A1:D4").Select()
spreadSheet1.Workbook.ActiveSheet.Shapes.AddChart(GrapeCity.Spreadsheet.Charts.ChartType.ColumnClustered, 100, 150, 400, 300, True)
spreadSheet1.Workbook.ActiveSheet.ChartObjects(0).Chart.ChartTitle.Text = "Sales Report"
Dim chartArea = spreadSheet1.Workbook.ActiveSheet.ChartObjects(0).Chart.ChartArea
chartArea.Format.Fill.BackColor.ObjectThemeColor = GrapeCity.Core.SchemeThemeColors.Accent1
chartArea.Format.Fill.ForeColor.ObjectThemeColor = GrapeCity.Core.SchemeThemeColors.Accent4