
- Spread for WPF Overview
- Key Features
- Getting Started
- Quick Start
- Designer
- Features
- Assembly Reference
Lines
In charts, there are some additonal elements that help users to understand the data easily and clearly when displayed.
This topic discusses some of those in the following sections.
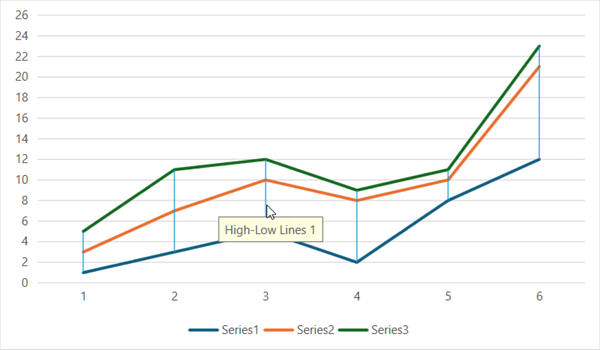
High-Low Lines
High-low lines extend from the highest value to the lowest value within each category of data series.
!type=note
Note: This feature is available only in the line charts.
You can use the ShowHiLoLines property and HiLoLines property of the IChartGroup interface to show and customize the high-low lines in a chart.
Refer to the example code below to configure the high-low lines of the line chart.
C#
object[,] values = new object[,] { { 1, 3, 5, 2, 8, 12 }, { 2, 4, 5, 6, 2, 9 }, { 2, 4, 2, 1, 1, 2 }, { 0, 4, 2, 1, 0, 2 }, { 1, 3, 5, 0, 8, 12 } };
var sheet1 = spreadSheet1.Workbook.ActiveSheet;
sheet1.SetValue(0, 0, values, false);
sheet1.Cells["A1:F3"].Select();
sheet1.Shapes.AddChart(GrapeCity.Spreadsheet.Charts.ChartType.LineStacked, 100, 50, 600, 350, false);
// Show HiLoLines.
sheet1.ChartObjects[0].Chart.ChartGroups[0].ShowHiLoLines = true;
sheet1.ChartObjects[0].Chart.ChartGroups[0].HiLoLines.Border.Color = GrapeCity.Spreadsheet.Color.FromThemeColor(GrapeCity.Core.ThemeColors.Accent4);
VB
Dim values = New Object(,) {
{1, 3, 5, 2, 8, 12},
{2, 4, 5, 6, 2, 9},
{2, 4, 2, 1, 1, 2},
{0, 4, 2, 1, 0, 2},
{1, 3, 5, 0, 8, 12}}
Dim sheet1 = spreadSheet1.Workbook.ActiveSheet
sheet1.SetValue(0, 0, values, False)
sheet1.Cells("A1:F3").[Select](/spreadnet/docs/latest/online-wpf/spreadwpffeatures/charts/chart-elements/other-chart-lines)
sheet1.Shapes.AddChart(GrapeCity.Spreadsheet.Charts.ChartType.LineStacked, 100, 50, 600, 350, False)
' Show HiLoLines.
sheet1.ChartObjects(0).Chart.ChartGroups(0).ShowHiLoLines = True
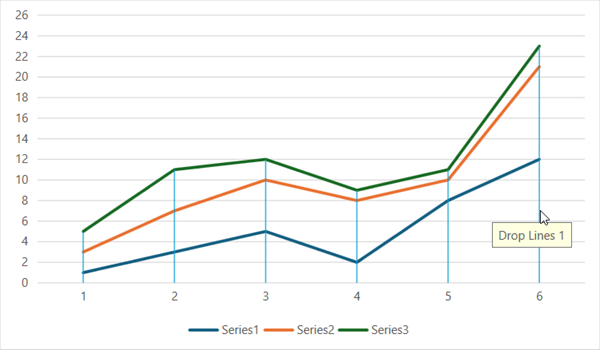
sheet1.ChartObjects(0).Chart.ChartGroups(0).HiLoLines.Border.Color = GrapeCity.Spreadsheet.Color.FromThemeColor(GrapeCity.Core.ThemeColors.Accent4)Drop Lines
On a chart, drop lines start at the highest data points and extend vertically down to the X-axis.
!type=note
Note: This feature is available only in line and area charts.
You can use the ShowDropLines property and DropLines property of the IChartGroup interface to show and customize the drop lines in a chart.
Refer to the example code below to apply drop lines to a line chart.
C#
object[,] values = new object[,] { { 1, 3, 5, 2, 8, 12 }, { 2, 4, 5, 6, 2, 9 }, { 2, 4, 2, 1, 1, 2 }, { 0, 4, 2, 1, 0, 2 }, { 1, 3, 5, 0, 8, 12 } };
var sheet1 = spreadSheet1.Workbook.ActiveSheet;
sheet1.SetValue(0, 0, values, false);
sheet1.Cells["A1:F3"].Select();
sheet1.Shapes.AddChart(GrapeCity.Spreadsheet.Charts.ChartType.LineStacked, 100, 50, 600, 350, false);
// Show droplines.
sheet1.ChartObjects[0].Chart.ChartGroups[0].ShowDropLines = true;
sheet1.ChartObjects[0].Chart.ChartGroups[0].DropLines.Border.Color = GrapeCity.Spreadsheet.Color.FromThemeColor(GrapeCity.Core.ThemeColors.Accent4);
VB
Dim values = New Object(,) {
    {1, 3, 5, 2, 8, 12},
    {2, 4, 5, 6, 2, 9},
    {2, 4, 2, 1, 1, 2},
    {0, 4, 2, 1, 0, 2},
    {1, 3, 5, 0, 8, 12}}
Dim sheet1 = spreadSheet1.Workbook.ActiveSheet
sheet1.SetValue(0, 0, values, False)
sheet1.Cells("A1:F3").[Select](/spreadnet/docs/latest/online-wpf/spreadwpffeatures/charts/chart-elements/other-chart-lines)
sheet1.Shapes.AddChart(GrapeCity.Spreadsheet.Charts.ChartType.LineStacked, 100, 50, 600, 350, False)
' Show droplines.
sheet1.ChartObjects(0).Chart.ChartGroups(0).ShowDropLines = True
sheet1.ChartObjects(0).Chart.ChartGroups(0).DropLines.Border.Color = GrapeCity.Spreadsheet.Color.FromThemeColor(GrapeCity.Core.ThemeColors.Accent4)