
Group
Spread for WPF supports outlining (grouping) data in a worksheet, which enables you to manage and navigate complex reports by organizing data into sections based on headers. Grouping rows and columns helps you summarize large datasets and create custom views in a worksheet, which is particularly useful for establishing hierarchical relationships between rows and columns.
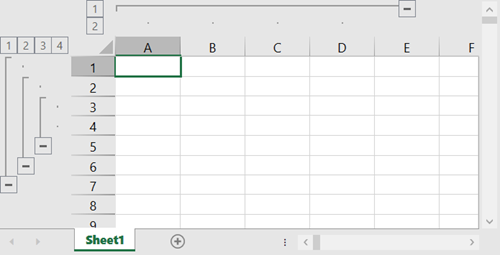
An outline appears next to the headers, allowing you to expand or collapse different levels of grouped rows or columns. Each group has a header row with icons that enable you to expand or collapse the group to show or hide information as needed. Expanding a group displays all hidden rows or columns; while collapsing it hides them again to keep your worksheet organized and easy to read.
The following image shows a four-level outline for rows and a two-level outline for columns.
Applying grouping in a worksheet involves various tasks discussed in the sections below.
Group Rows
You can apply row grouping by using the Group method of the IRange interface and specifying the rows you want to apply grouping on.
Refer to the following example code to apply row grouping in a worksheet.
C#
// Group rows.
spreadSheet1.Workbook.ActiveSheet.Range("1:6").Group();
spreadSheet1.Workbook.ActiveSheet.Range("2:5").Group();
VB
' Group rows.
spreadSheet1.Workbook.ActiveSheet.Range("1:6").Group()
spreadSheet1.Workbook.ActiveSheet.Range("2:5").Group()
Group Columns
You can apply column grouping by using the Group method of the IRange interface and specifying the columns you want to apply grouping on.
Refer to the following example code to apply column grouping in a worksheet.
C#
// Group columns.
spreadSheet1.Workbook.ActiveSheet.Range("A:D").Group();
VB
' Group columns.
spreadSheet1.Workbook.ActiveSheet.Range("A:D").Group()
Ungroup Rows and Columns
The grouped rows or columns can be ungrouped if you no longer want the information to be organized in clusters. You can increment or decrement the outline level for the specified rows or columns using the Group method and Ungroup method of the IRange interface, respectively.
Refer to the following example code to ungroup rows and columns in a worksheet.
C#
// Group row.
spreadSheet1.Workbook.ActiveSheet.Range( "1:6" ).Group();
spreadSheet1.Workbook.ActiveSheet.Range( "2:5" ).Group();
spreadSheet1.Workbook.ActiveSheet.Range( "3:4" ).Group();
// Ungroup row.
spreadSheet1.Workbook.ActiveSheet.Range( "3:4" ).Ungroup();
// Group column.
spreadSheet1.Workbook.ActiveSheet.Range( "A:D" ).Group();
// Ungroup column.
spreadSheet1.Workbook.ActiveSheet.Range( "A:D" ).Ungroup();
VB
' Group row.
spreadSheet1.Workbook.ActiveSheet.Range("1:6").Group()
spreadSheet1.Workbook.ActiveSheet.Range("2:5").Group()
spreadSheet1.Workbook.ActiveSheet.Range("3:4").Group()
' Ungroup row.
spreadSheet1.Workbook.ActiveSheet.Range("3:4").Ungroup()
' Group column.
spreadSheet1.Workbook.ActiveSheet.Range("A:D").Group()
' Ungroup column.
spreadSheet1.Workbook.ActiveSheet.Range("A:D").Ungroup()
Collapse a Group
You can collapse a group by setting the ShowDetail property of the IRange interface to false. By default, this property value is true.
Refer to the following example code to collapse a group in a worksheet.
C#
// Collapse group of 1:10 rows.
spreadSheet1.Workbook.ActiveSheet.Range("11:11").ShowDetail = false;
VB
' Collapse group of 1:10 rows.
spreadSheet1.Workbook.ActiveSheet.Range("11:11").ShowDetail = False
Set Outline Levels
The outline level indicates a task's position in the project hierarchy. This position is represented by a number. To set the current outline level for grouping rows or columns, you can use the OutlineLevel property of the IRange interface.
Refer to the following example code to set the outline level for rows and columns.
C#
// Set outline level.
spreadSheet1.Workbook.ActiveSheet.Range("1:6").OutlineLevel = 2;
spreadSheet1.Workbook.ActiveSheet.Range("A:D").OutlineLevel = 4;
VB
' Set outline level.
spreadSheet1.Workbook.ActiveSheet.Range("1:6").OutlineLevel = 2
spreadSheet1.Workbook.ActiveSheet.Range("A:D").OutlineLevel = 4