
- Spread for WPF Overview
- Key Features
- Getting Started
- Quick Start
- Designer
- Features
- Assembly Reference
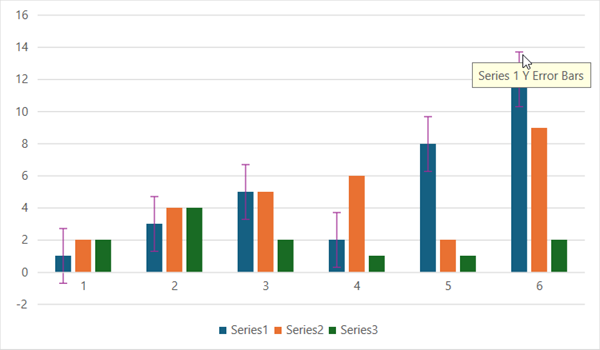
Error Bar
Error bars are used in charts to indicate the estimated error or uncertainty in the measured data to give an idea about how precise that data is. They most often represent this through the standard deviation of the data set. Error bars are, generally useful while plotting results of scientific studies, experiments, or any other measurements that show variation in data from original values.
To apply error bars to the chart series, use the ErrorBar method of the ISeries interface. You can add and customize error bars according to your specific requirements, ensuring an accurate representation of data in charts.
Refer to the following example code to add error bars.
C#
object[,] values = new object[,] { { 1, 3, 5, 2, 8, 12 }, { 2, 4, 5, 6, 2, 9 }, { 2, 4, 2, 1, 1, 2 }, { 0, 4, 2, 1, 0, 2 }, { 1, 3, 5, 0, 8, 12 } };
var sheet1 = spreadSheet1.Workbook.ActiveSheet;
sheet1.SetValue(0, 0, values, false);
sheet1.Cells["A1:F3"].Select();
sheet1.Shapes.AddChart(GrapeCity.Spreadsheet.Charts.ChartType.ColumnClustered, 100, 50, 600, 350, false);
// Show error bars.
spreadSheet1.Workbook.ActiveSheet.ChartObjects[0].Chart.Series[0].ErrorBar(ErrorBarDirection.Y, ErrorBarInclude.Both, ErrorBarType.StandardError);
spreadSheet1.Workbook.ActiveSheet.ChartObjects[0].Chart.Series[0].ErrorBars.Border.Color = GrapeCity.Spreadsheet.Color.FromThemeColor(GrapeCity.Core.ThemeColors.Accent5);
VB
Dim values = New Object(,) {
    {1, 3, 5, 2, 8, 12},
    {2, 4, 5, 6, 2, 9},
    {2, 4, 2, 1, 1, 2},
    {0, 4, 2, 1, 0, 2},
    {1, 3, 5, 0, 8, 12}}
Dim sheet1 = spreadSheet1.Workbook.ActiveSheet
sheet1.SetValue(0, 0, values, False)
sheet1.Cells("A1:F3").[Select](/spreadnet/docs/latest/online-wpf/spreadwpffeatures/charts/chart-elements/error-bar)
sheet1.Shapes.AddChart(GrapeCity.Spreadsheet.Charts.ChartType.ColumnClustered, 100, 50, 600, 350, False)
' Show error bars.
spreadSheet1.Workbook.ActiveSheet.ChartObjects(0).Chart.Series(0).ErrorBar(ErrorBarDirection.Y, ErrorBarInclude.Both, ErrorBarType.StandardError)
spreadSheet1.Workbook.ActiveSheet.ChartObjects(0).Chart.Series(0).ErrorBars.Border.Color = GrapeCity.Spreadsheet.Color.FromThemeColor(GrapeCity.Core.ThemeColors.Accent5)