
- Spread for WPF Overview
- About the Product
- Getting Started
- Quick Start
- Designer
- Features
- Assembly Reference
Data Label
Data Labels add specific details to individual data points in a data series. They are used to ensure that users can easily understand and interpret the information plotted in a chart.
You can get or set the data labels, change their position and color, and control whether to show the data labels in the chart using the ApplyDataLabels method of the IChart interface. It returns the members of DataLabelVisibilities enumeration.

The following example code shows how to configure data labels in a chart.
C#
spreadSheet1.Workbook.ActiveSheet.Cells[0, 1].Value = "Q1";
spreadSheet1.Workbook.ActiveSheet.Cells[0, 2].Value = "Q2";
spreadSheet1.Workbook.ActiveSheet.Cells[0, 3].Value = "Q3";
spreadSheet1.Workbook.ActiveSheet.Cells[1, 0].Value = "Mobile Phones";
spreadSheet1.Workbook.ActiveSheet.Cells[2, 0].Value = "Laptops";
spreadSheet1.Workbook.ActiveSheet.Cells[3, 0].Value = "Tablets";
for (var r = 1; r <= 3; r++)
{
     for (var c = 1; c <= 3; c++)
     {
        Random random = new Random();
        spreadSheet1.Workbook.ActiveSheet.Cells[r, c].Value = 0 + random.Next(0, 100);
     }
}
spreadSheet1.Workbook.ActiveSheet.Cells["A1:D4"].Select();
spreadSheet1.Workbook.ActiveSheet.Shapes.AddChart(GrapeCity.Spreadsheet.Charts.ChartType.ColumnClustered, 100, 150, 400, 300, true);
spreadSheet1.Workbook.ActiveSheet.ChartObjects[0].Chart.ChartTitle.Text = "Sales Report";
spreadSheet1.Workbook.ActiveSheet.ChartObjects[0].Chart.ApplyDataLabels(DataLabelVisibilities.Value);
VB
spreadSheet1.Workbook.ActiveSheet.Cells(0, 1).Value = "Q1"
spreadSheet1.Workbook.ActiveSheet.Cells(0, 2).Value = "Q2"
spreadSheet1.Workbook.ActiveSheet.Cells(0, 3).Value = "Q3"
spreadSheet1.Workbook.ActiveSheet.Cells(1, 0).Value = "Mobile Phones"
spreadSheet1.Workbook.ActiveSheet.Cells(2, 0).Value = "Laptops"
spreadSheet1.Workbook.ActiveSheet.Cells(3, 0).Value = "Tablets"
For r = 1 To 3
        For c = 1 To 3
            Dim random As Random = New Random()
            spreadSheet1.Workbook.ActiveSheet.Cells(r, c).Value = 0 + random.Next(0, 100)
        Next
Next
spreadSheet1.Workbook.ActiveSheet.Cells("A1:D4").Select()
spreadSheet1.Workbook.ActiveSheet.Shapes.AddChart(GrapeCity.Spreadsheet.Charts.ChartType.ColumnClustered, 100, 150, 400, 300, True)
spreadSheet1.Workbook.ActiveSheet.ChartObjects(0).Chart.ChartTitle.Text = "Sales Report"
spreadSheet1.Workbook.ActiveSheet.ChartObjects(0).Chart.ApplyDataLabels(DataLabelVisibilities.Value)
Add Shapes to Data Labels
Spread for WPF provides various properties related to data labels which can improve the overall appearance and clear understanding of the chart.
You can customize the shape of data labels using the DataLabels.Format.AutoShapeType property. This property allows you to set the shape of the data labels. It takes the value of GrapeCity.Spreadsheet.Drawing.AutoShapeType enumeration and changes the shape of data labels accordingly.
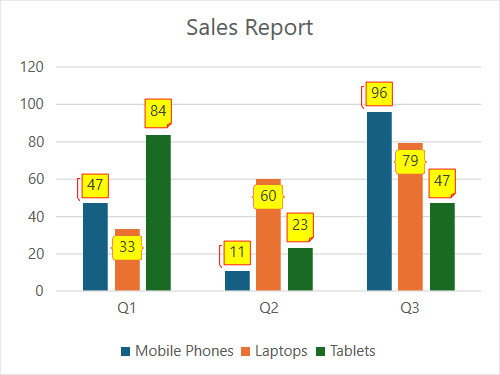
The following example code sets the different shapes to data labels of different series of charts as Callout3Border, BracePair, and FoldedCorner for series 0, 1, and 2, respectively.
C#
spreadSheet1.Workbook.ActiveSheet.Cells[0, 1].Value = "Q1";
spreadSheet1.Workbook.ActiveSheet.Cells[0, 2].Value = "Q2";
spreadSheet1.Workbook.ActiveSheet.Cells[0, 3].Value = "Q3";
spreadSheet1.Workbook.ActiveSheet.Cells[1, 0].Value = "Mobile Phones";
spreadSheet1.Workbook.ActiveSheet.Cells[2, 0].Value = "Laptops";
spreadSheet1.Workbook.ActiveSheet.Cells[3, 0].Value = "Tablets";
for (var r = 1; r <= 3; r++)
{
    for (var c = 1; c <= 3; c++)
    {
        Random random = new Random();
        spreadSheet1.Workbook.ActiveSheet.Cells[r, c].Value = 0 + random.Next(0, 100);
    }
}
spreadSheet1.Workbook.ActiveSheet.Cells["A1:D4"].Select();
spreadSheet1.Workbook.ActiveSheet.Shapes.AddChart(GrapeCity.Spreadsheet.Charts.ChartType.ColumnClustered, 100, 150, 400, 300, true);
spreadSheet1.Workbook.ActiveSheet.ChartObjects[0].Chart.ChartTitle.Text = "Sales Report";

spreadSheet1.Workbook.ActiveSheet.ChartObjects[0].Chart.Series[0].ShowDataLabels = true;
spreadSheet1.Workbook.ActiveSheet.ChartObjects[0].Chart.Series[0].DataLabels.Format.Fill.ForeColor.ARGB = System.Drawing.Color.Yellow.ToArgb();
spreadSheet1.Workbook.ActiveSheet.ChartObjects[0].Chart.Series[0].DataLabels.Format.Line.ForeColor.ARGB = System.Drawing.Color.Red.ToArgb();
spreadSheet1.Workbook.ActiveSheet.ChartObjects[0].Chart.Series[0].DataLabels.Format.AutoShapeType = AutoShapeType.Callout3Border;

spreadSheet1.Workbook.ActiveSheet.ChartObjects[0].Chart.Series[1].ShowDataLabels = true;
spreadSheet1.Workbook.ActiveSheet.ChartObjects[0].Chart.Series[1].DataLabels.Format.Fill.ForeColor.ARGB = System.Drawing.Color.Yellow.ToArgb();
spreadSheet1.Workbook.ActiveSheet.ChartObjects[0].Chart.Series[1].DataLabels.Format.Line.ForeColor.ARGB = System.Drawing.Color.Red.ToArgb();
spreadSheet1.Workbook.ActiveSheet.ChartObjects[0].Chart.Series[1].DataLabels.Format.AutoShapeType = AutoShapeType.BracePair;
spreadSheet1.Workbook.ActiveSheet.ChartObjects[0].Chart.Series[1].DataLabels.Position = DataLabelPosition.InsideEnd;

spreadSheet1.Workbook.ActiveSheet.ChartObjects[0].Chart.Series[2].ShowDataLabels = true;
spreadSheet1.Workbook.ActiveSheet.ChartObjects[0].Chart.Series[2].DataLabels.Format.Fill.ForeColor.ARGB = System.Drawing.Color.Yellow.ToArgb();
spreadSheet1.Workbook.ActiveSheet.ChartObjects[0].Chart.Series[2].DataLabels.Format.Line.ForeColor.ARGB = System.Drawing.Color.Red.ToArgb();
spreadSheet1.Workbook.ActiveSheet.ChartObjects[0].Chart.Series[2].DataLabels.Format.AutoShapeType = AutoShapeType.FoldedCorner;
VB
spreadSheet1.Workbook.ActiveSheet.Cells(0, 1).Value = "Q1"
spreadSheet1.Workbook.ActiveSheet.Cells(0, 2).Value = "Q2"
spreadSheet1.Workbook.ActiveSheet.Cells(0, 3).Value = "Q3"
spreadSheet1.Workbook.ActiveSheet.Cells(1, 0).Value = "Mobile Phones"
spreadSheet1.Workbook.ActiveSheet.Cells(2, 0).Value = "Laptops"
spreadSheet1.Workbook.ActiveSheet.Cells(3, 0).Value = "Tablets"

For r = 1 To 3
    For c = 1 To 3
        Dim random As Random = New Random()
        spreadSheet1.Workbook.ActiveSheet.Cells(r, c).Value = 0 + random.Next(0, 100)
    Next
Next

spreadSheet1.Workbook.ActiveSheet.Cells("A1:D4").[Select]()
spreadSheet1.Workbook.ActiveSheet.Shapes.AddChart(GrapeCity.Spreadsheet.Charts.ChartType.ColumnClustered, 100, 150, 400, 300, True)
spreadSheet1.Workbook.ActiveSheet.ChartObjects(0).Chart.ChartTitle.Text = "Sales Report"

spreadSheet1.Workbook.ActiveSheet.ChartObjects(0).Chart.Series(0).ShowDataLabels = True
spreadSheet1.Workbook.ActiveSheet.ChartObjects(0).Chart.Series(0).DataLabels.Format.Fill.ForeColor.ARGB = Drawing.Color.Yellow.ToArgb()
spreadSheet1.Workbook.ActiveSheet.ChartObjects(0).Chart.Series(0).DataLabels.Format.Line.ForeColor.ARGB = Drawing.Color.Red.ToArgb()
spreadSheet1.Workbook.ActiveSheet.ChartObjects(0).Chart.Series(0).DataLabels.Format.AutoShapeType = AutoShapeType.Callout3Border

spreadSheet1.Workbook.ActiveSheet.ChartObjects(0).Chart.Series(1).ShowDataLabels = True
spreadSheet1.Workbook.ActiveSheet.ChartObjects(0).Chart.Series(1).DataLabels.Format.Fill.ForeColor.ARGB = Drawing.Color.Yellow.ToArgb()
spreadSheet1.Workbook.ActiveSheet.ChartObjects(0).Chart.Series(1).DataLabels.Format.Line.ForeColor.ARGB = Drawing.Color.Red.ToArgb()
spreadSheet1.Workbook.ActiveSheet.ChartObjects(0).Chart.Series(1).DataLabels.Format.AutoShapeType = AutoShapeType.BracePair
spreadSheet1.Workbook.ActiveSheet.ChartObjects(0).Chart.Series(1).DataLabels.Position = DataLabelPosition.InsideEnd

spreadSheet1.Workbook.ActiveSheet.ChartObjects(0).Chart.Series(2).ShowDataLabels = True
spreadSheet1.Workbook.ActiveSheet.ChartObjects(0).Chart.Series(2).DataLabels.Format.Fill.ForeColor.ARGB = Drawing.Color.Yellow.ToArgb()
spreadSheet1.Workbook.ActiveSheet.ChartObjects(0).Chart.Series(2).DataLabels.Format.Line.ForeColor.ARGB = Drawing.Color.Red.ToArgb()
spreadSheet1.Workbook.ActiveSheet.ChartObjects(0).Chart.Series(2).DataLabels.Format.AutoShapeType = AutoShapeType.FoldedCorner
Data Label and Legend Text Orientation
You can set the text orientation for data labels and the chart legend to improve layout or support East Asian text. Use the TextOrientation property to choose horizontal, vertical, or Far East vertical styles.
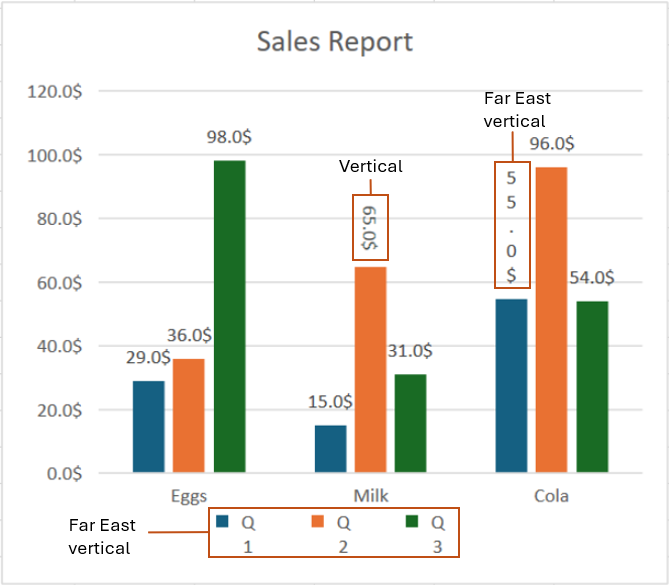
The following example demonstrates how to set text orientation for data labels and the legend.
C#
// Set data.
spreadSheet1.Workbook.ActiveSheet.Cells[0, 1].Value = "Eggs";
spreadSheet1.Workbook.ActiveSheet.Cells[0, 2].Value = "Milk";
spreadSheet1.Workbook.ActiveSheet.Cells[0, 3].Value = "Cola";
spreadSheet1.Workbook.ActiveSheet.Cells[1, 0].Value = "Q1";
spreadSheet1.Workbook.ActiveSheet.Cells[2, 0].Value = "Q2";
spreadSheet1.Workbook.ActiveSheet.Cells[3, 0].Value = "Q3";
Random random = new Random();
for (var r = 1; r <= 3; r++)
{
    for (var c = 1; c <= 3; c++)
    {
        spreadSheet1.Workbook.ActiveSheet.Cells[r, c].Value = 0 + random.Next(0, 100);
    }
}
spreadSheet1.Workbook.ActiveSheet.Cells["A1:D4"].Select();
spreadSheet1.Workbook.ActiveSheet.Cells["A1:D4"].NumberFormat = "0.0$";

// Add a clustered column chart.
spreadSheet1.Workbook.ActiveSheet.Shapes.AddChart(GrapeCity.Spreadsheet.Charts.ChartType.ColumnClustered, 100, 150, 400, 350, true);
spreadSheet1.Workbook.ActiveSheet.ChartObjects[0].Chart.ChartTitle.Text = "Sales Report";
spreadSheet1.Workbook.ActiveSheet.ChartObjects[0].Chart.ApplyDataLabels(DataLabelVisibilities.Value);

// Show the legend on the chart.
spreadSheet1.Workbook.ActiveSheet.ChartObjects[0].Chart.ShowLegend();
spreadSheet1.Workbook.ActiveSheet.ChartObjects[0].Chart.Legend.Width = 200;
spreadSheet1.Workbook.ActiveSheet.ChartObjects[0].Chart.Legend.Height = 60;
spreadSheet1.Workbook.ActiveSheet.ChartObjects[0].Chart.Series[0].ApplyDataLabels(DataLabelVisibilities.Value);

// Set data label to vertical.
spreadSheet1.Workbook.ActiveSheet.ChartObjects[0].Chart.Series[1].DataLabels[1].TextOrientation = TextOrientation.Vertical;

// Set data label to rotated horizontal.
spreadSheet1.Workbook.ActiveSheet.ChartObjects[0].Chart.Series[0].DataLabels[2].TextOrientation = TextOrientation.HorizontalRotatedFarEast;

// Set legend text to rotated horizontal.
spreadSheet1.Workbook.ActiveSheet.ChartObjects[0].Chart.Legend.TextOrientation = TextOrientation.HorizontalRotatedFarEast;
VB
' Set data.
spreadSheet1.Workbook.ActiveSheet.Cells(0, 1).Value = "Eggs"
spreadSheet1.Workbook.ActiveSheet.Cells(0, 2).Value = "Milk"
spreadSheet1.Workbook.ActiveSheet.Cells(0, 3).Value = "Cola"
spreadSheet1.Workbook.ActiveSheet.Cells(1, 0).Value = "Q1"
spreadSheet1.Workbook.ActiveSheet.Cells(2, 0).Value = "Q2"
spreadSheet1.Workbook.ActiveSheet.Cells(3, 0).Value = "Q3"

Dim random As New Random()
For r As Integer = 1 To 3
    For c As Integer = 1 To 3
        spreadSheet1.Workbook.ActiveSheet.Cells(r, c).Value = 0 + random.Next(0, 100)
    Next
Next

spreadSheet1.Workbook.ActiveSheet.Cells("A1:D4").Select()
spreadSheet1.Workbook.ActiveSheet.Cells("A1:D4").NumberFormat = "0.0$"

' Add a clustered column chart.
spreadSheet1.Workbook.ActiveSheet.Shapes.AddChart(GrapeCity.Spreadsheet.Charts.ChartType.ColumnClustered, 100, 150, 400, 350, True)
spreadSheet1.Workbook.ActiveSheet.ChartObjects(0).Chart.ChartTitle.Text = "Sales Report"
spreadSheet1.Workbook.ActiveSheet.ChartObjects(0).Chart.ApplyDataLabels(DataLabelVisibilities.Value)

' Show the legend on the chart.
spreadSheet1.Workbook.ActiveSheet.ChartObjects(0).Chart.ShowLegend()
spreadSheet1.Workbook.ActiveSheet.ChartObjects(0).Chart.Legend.Width = 200
spreadSheet1.Workbook.ActiveSheet.ChartObjects(0).Chart.Legend.Height = 60
spreadSheet1.Workbook.ActiveSheet.ChartObjects(0).Chart.Series(0).ApplyDataLabels(DataLabelVisibilities.Value)

' Set data label to vertical.
spreadSheet1.Workbook.ActiveSheet.ChartObjects(0).Chart.Series(1).DataLabels(1).TextOrientation = TextOrientation.Vertical

' Set data label to rotated horizontal.
spreadSheet1.Workbook.ActiveSheet.ChartObjects(0).Chart.Series(0).DataLabels(2).TextOrientation = TextOrientation.HorizontalRotatedFarEast

' Set legend text to rotated horizontal.
spreadSheet1.Workbook.ActiveSheet.ChartObjects(0).Chart.Legend.TextOrientation = TextOrientation.HorizontalRotatedFarEast