
- Spread for WPF Overview
- Key Features
- Getting Started
- Quick Start
- Designer
- Features
- Assembly Reference
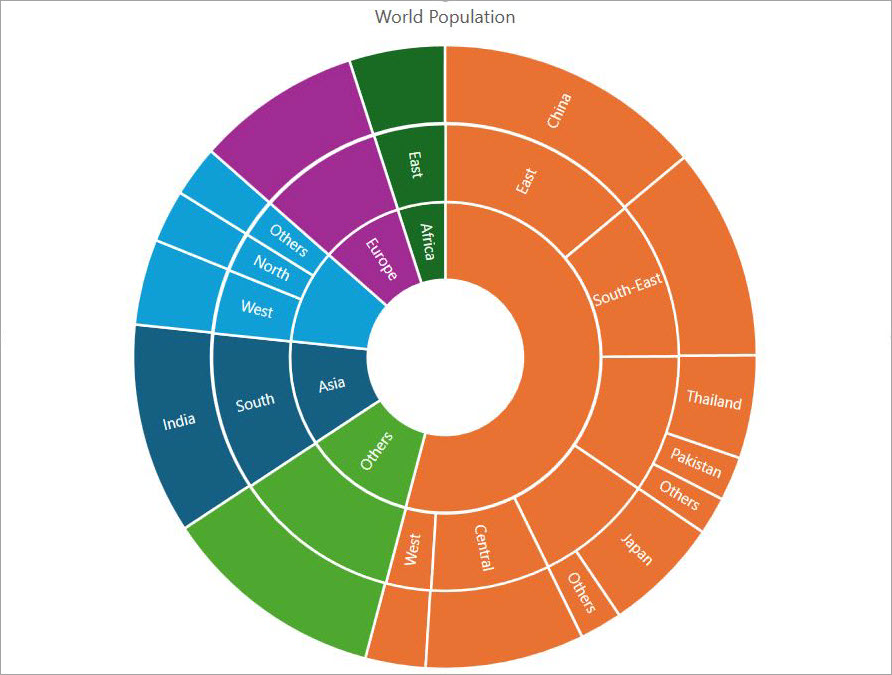
Sunburst Chart
Sunburst charts are used to display hierarchical data as concentric rings. Each ring in the chart represents a level in the hierarchy where the innermost ring is at the top of the hierarchy. The segments in each ring divide the data into sub-categories. The sizes of the segments indicate the proportion of data as per their parent category.
You can use this type of chart when data is organized hierarchically and has multiple categories.
Sample Image | Description |
|---|---|
| ChartType.Sunburst Represents a sunburst chart. It is used to compare values across hierarchy levels. |
Using Code
Refer to the following example code to add a sunburst chart.
C#
// Sunburst chart
object[,] dataArraySubBurst = {
   {"Region", "Subregion", "Country", "Population"},
   {"Asia", "South", "India", 9540554},
   {"","" , "Pakistan", 2003818},
   {"","" , "Thailand", 4668149},
   {"","" , "Others", 1702200},
   {"", "East", "China", 12155928},
   {"","" , "Japan", 5271332},
   {"","" , "Others", 1916573},
   {"", "South-East","" , 9556576},
   {"", "West","" , 2728399},
   {"", "Central", "", 7186065},
   {"Africa", "East","" , 4333132},
   {"", "West","" , 3880688},
   {"", "North","" , 2374677},
   {"", "Others","" , 2312021},
   {"Europe","" ,"" , 7448010},
   {"Others","" ,"" , 10117703}
};
for (int i = 0; i < dataArraySubBurst.GetLength(0); i++)
{
     for (int j = 0; j < dataArraySubBurst.GetLength(1); j++)
     {
         spreadSheet1.Workbook.ActiveSheet.Cells[i, j].Value = dataArraySubBurst[i, j];
     }
}
spreadSheet1.Workbook.ActiveSheet.Cells["A1:D17"].Select();
spreadSheet1.Workbook.ActiveSheet.Shapes.AddChart(GrapeCity.Spreadsheet.Charts.ChartType.Sunburst, 200, 350, 500, 400, false);
spreadSheet1.Workbook.ActiveSheet.ChartObjects[0].Chart.ChartTitle.Text = "World Population";
spreadSheet1.Workbook.ActiveSheet.ChartObjects[0].Chart.ApplyDataLabels(DataLabelVisibilities.CategoryName);
VB
' Sunburst chart
Dim dataArraySubBurst = {
       {"Region", "Subregion", "Country", "Population"},
       {"Asia", "South", "India", 9540554},
       {"", "", "Pakistan", 2003818},
       {"", "", "Thailand", 4668149},
       {"", "", "Others", 1702200},
       {"", "East", "China", 12155928},
       {"", "", "Japan", 5271332},
       {"", "", "Others", 1916573},
       {"", "South-East", "", 9556576},
       {"", "West", "", 2728399},
       {"", "Central", "", 7186065},
       {"Africa", "East", "", 4333132},
       {"", "West", "", 3880688},
       {"", "North", "", 2374677},
       {"", "Others", "", 2312021},
       {"Europe", "", "", 7448010},
       {"Others", "", "", 10117703}}
For i = 0 To dataArraySubBurst.GetLength(0) - 1
    For j = 0 To dataArraySubBurst.GetLength(1) - 1
        spreadSheet1.Workbook.ActiveSheet.Cells(i, j).Value = dataArraySubBurst(i, j)
    Next
Next
spreadSheet1.Workbook.ActiveSheet.Cells("A1:D17").[Select]()
spreadSheet1.Workbook.ActiveSheet.Shapes.AddChart(GrapeCity.Spreadsheet.Charts.ChartType.Sunburst, 200, 350, 500, 400, False)
spreadSheet1.Workbook.ActiveSheet.ChartObjects(0).Chart.ChartTitle.Text = "World Population"
spreadSheet1.Workbook.ActiveSheet.ChartObjects(0).Chart.ApplyDataLabels(DataLabelVisibilities.CategoryName)