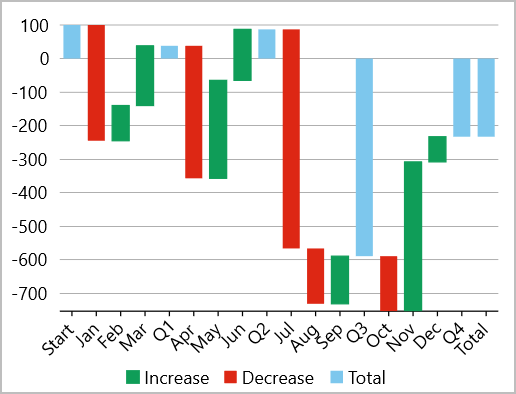
Waterfall charts are the statistical charts that demonstrate the cumulative effect of increasing and decreasing intermediate values on an initial value to result in a final value. These charts generally represent the initial and final values as blue colored total columns and intermediate values as green and red floating columns for increments and decrements respectively. These charts are helpful in scenarios such as viewing fluctuations in product earnings or for profit analysis as shown in the chart below.
In FlexChart, a waterfall chart can be implemented using the Waterfall class which represents a waterfall series. Apart from other series related properties, this class provides properties specific to waterfall series such as the ShowTotal or ShowIntermediateTotal properties, which let you specify whether to display the total or intermediate total columns or not. You can also choose whether to display the connector lines using the ConnectorLines property. FlexChart also allows you to change the style of these columns by setting the RisingStyle, FallingStyle, TotalStyle, and StartStyle properties respectively.
To create a Waterfall chart with total columns and connector lines, use the following code.
| XAML |
Copy Code
|
|---|---|
<c1:FlexChart x:Name="flexChart" ToolTipContent="{}{x}
Value: {y}" ItemsSource="{Binding Data}" BindingX="Name" Binding="Value" LegendPosition="Bottom"> <c1:FlexChart.AxisX> <c1:Axis LabelAngle="45" /> </c1:FlexChart.AxisX> <c1:Waterfall x:Name="wf" RelativeData="True" ShowTotal="True" Start="100" ShowIntermediateTotal="True" IntermediateTotalLabels="Q1,Q2,Q3,Q4" SeriesName="Increase, Decrease, Total"> <c1:Waterfall.StartStyle> <c1:ChartStyle Fill="#7dc7ed" /> </c1:Waterfall.StartStyle> <c1:Waterfall.FallingStyle> <c1:ChartStyle Fill="#dd2714" /> </c1:Waterfall.FallingStyle> <c1:Waterfall.RisingStyle> <c1:ChartStyle Fill="#0f9d58" Stroke="#0f9d58" /> </c1:Waterfall.RisingStyle> <c1:Waterfall.IntermediateTotalStyle> <c1:ChartStyle Fill="#7dc7ed" /> </c1:Waterfall.IntermediateTotalStyle> <c1:Waterfall.TotalStyle> <c1:ChartStyle Fill="#7dc7ed" /> </c1:Waterfall.TotalStyle> <c1:Waterfall.ConnectorLineStyle> <c1:ChartStyle Stroke="#888" StrokeDashArray="3,3" StrokeThickness="2"/> </c1:Waterfall.ConnectorLineStyle> </c1:Waterfall> </c1:FlexChart> |
|
The following C# code showcases the data used for the Waterfall chart.
| C# |
Copy Code
|
|---|---|
List<object> _data; public WaterfallChart() { InitializeComponent(); wf.IntermediateTotalPositions = new List<int> { 3, 6, 9, 12 }; } public List<object> Data => _data != null ? _data : _data = CreateData(); public static List<object> CreateData() { var rnd = new Random(); var items = new List<object>(); string[] names = new[] { "Jan", "Feb", "Mar", "Apr", "May", "Jun", "Jul", "Aug", "Sep", "Oct", "Nov", "Dec" }; foreach (var name in names) { items.Add(new { Name = name, Value = Math.Round((0.5 - rnd.NextDouble()) * 1000) }); } return items; } |
|