
Axes
Most of the chart types are plotted between the two axes, horizontal axis and vertical axis commonly known as X and Y-axis respectively. Often X-axis is used to plot categories and Y-axis to plot values, however in some cases such as bar chart, Y-axis is used as a category axis while X-axis is used as a value axis. Similarly, depending on the data, there are cases when both of the axes are used as value axis. Note that charts such as pie chart, sunburst or treemap are some of the exceptions to this and do not possess any axis.
In FlexChart, the two axes are represented by the AxisX and AxisY property which returns an object of the Axis class.
You can configure the X and Y axes by setting the BindingX and Binding property as shown in the following code. This sample uses the data used in Quick Start.
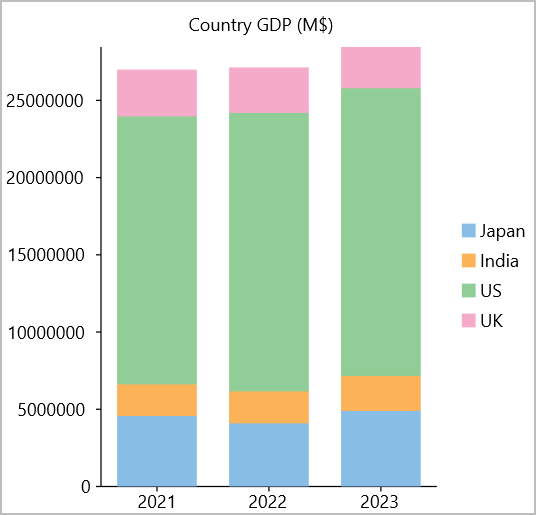
<c1:FlexChart x:Name="chart" BindingX="year" Stacking="Stacked" Header="Country GDP (M$)"
               ChartType="Column" LegendPosition="Bottom" ItemsSource="{Binding ListItem}">
    <c1:Series Binding="Japan" SeriesName="Japan"/>
    <c1:Series Binding="India" SeriesName="India"/>
    <c1:Series Binding="US" SeriesName="US"/>
    <c1:Series Binding="UK" SeriesName="UK"/>
</c1:FlexChart>
Position an Axis
By default, FlexChart renders the X-axis at bottom and Y-axis on left side of the chart. However, you can change the position of these axes by setting the Position property which accepts the values from Position enumeration. Also, setting this property to None hides the axis itself.
The following code illustrates how to set the position for the Axes in the FlexChart created in the above section. This sample uses the data used in Quick Start.
<c1:FlexChart x:Name="chart" BindingX="year" Stacking="Stacked" Header="Country GDP (M$)"
              ChartType="Column" LegendPosition="Bottom" ItemsSource="{Binding ListItem}">
    <c1:Series Binding="Japan" SeriesName="Japan"/>
    <c1:Series Binding="India" SeriesName="India"/>
    <c1:Series Binding="US" SeriesName="US"/>
    <c1:Series Binding="UK" SeriesName="UK"/>
    <c1:FlexChart.AxisX>
        <c1:Axis Position="Bottom" />
    </c1:FlexChart.AxisX>
    <c1:FlexChart.AxisY>
        <c1:Axis Position="Right" />
    </c1:FlexChart.AxisY>
</c1:FlexChart>
Set Axis Bounds or Scale
Axis bounds or scale is an essential factor in determining how do you want to present your data and your audience to interpret it. Although FlexChart automatically creates an appropriate scale based on the data provided to it, you can also modify the scale by setting the Min and Max properties. Clearly, the concept of axis scale is only applicable to the value axis and is not valid for a categorical axis.
flexChart.AxisY.Min = 0;
Display Reverse Axis
In some cases, flipping an axis to start displaying the values from maximum to minimum helps in better presentation of data such as height of various waterfalls or depth of an ocean at different levels. FlexChart lets you display the reversed axis by setting the Reversed property to True.
flexChart.AxisY.Reversed = true;