Data Labels
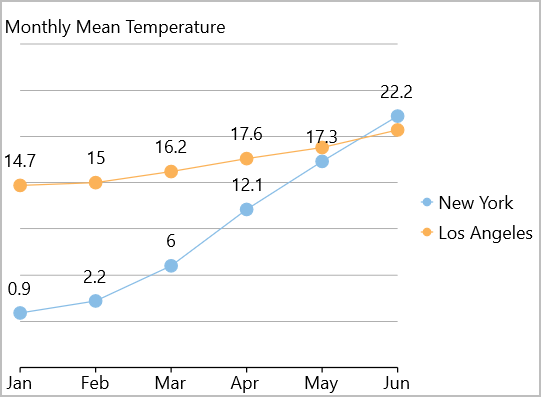
Data labels are the labels associated with the data points, generally, displaying the value of those data points. They are especially useful in the charts where it is difficult to know the exact value of data points by simply looking at them.

In FlexChart, you can display the data labels by setting the DataLabel property which is of type DataLabel class. You can also set the ContentOptions property of the DataLabel class to specify what to display in the data labels. Additionally, you can specify where to display the data labels with respect to the data point using the Position property. This property accepts the values from C1.Chart.LabelPosition enumeration which allows you to position the data labels towards the top, bottom, center, left or right of the data point. The default value of the Position property is Auto, which, automatically positions the data labels according to the available space on the chart. However, you also have an option to set this value to None. Moreover, you can set the offset of data label from corresponding data point as showcased in the following code.
<c1:FlexChart x:Name="flexChart" Header="Monthly Mean Temperature" HeaderAlignment="Left"
          ChartType="LineSymbols" BindingX="month" ItemsSource="{Binding Data}" >
    <c1:FlexChart.AxisY>
        <c1:Axis Labels="False" AxisLine="False" MajorGrid="True" MajorTickMarks="None" Min="-5" Max="30" />
    </c1:FlexChart.AxisY>
    <c1:FlexChart.DataLabel>
        <c1:DataLabel Content="{}{value}" Position="Top" Offset="10"/>
    </c1:FlexChart.DataLabel>
    <c1:Series SeriesName="New York" Binding="NewYork"/>
    <c1:Series SeriesName="Los Angeles" Binding="LosAngeles"/>
</c1:FlexChart>
Following code defines the data to be used in the above chart:
public object[] Data => ClimateData.GetData();
class ClimateData
{
    public static object[] GetData()
    {
        return new object[]
        {
            new { month = "Jan", NewYork =  0.9, LosAngeles = 14.7, Seattle =  6.0},
            new { month = "Feb", NewYork =  2.2, LosAngeles = 15.0, Seattle =  6.7},
            new { month = "Mar", NewYork =  6.0, LosAngeles = 16.2, Seattle =  8.4},
            new { month = "Apr", NewYork = 12.1, LosAngeles = 17.6, Seattle = 10.7},
            new { month = "May", NewYork = 17.3, LosAngeles = 18.8, Seattle = 14.2},
            new { month = "Jun", NewYork = 22.2, LosAngeles = 20.7, Seattle = 16.7},
        };
    }
}


