
Financial Charts
Financial chart are the chart types specifically designed to be used in the financial industry. FlexChart supports financial charts t visualize and analyze financial data.
FlexChart allows you to create two types of financial charts as shown in the following table:
| Chart Type | Description |
|---|---|
| Candlestick | Candlestick charts are financial charts to plot open, close, high and low values of a stock over short periods of time. Each candlestick in these charts consist of a body, a wick and a tail. While body of a candlestick chart represents the opening and closing values of the stock in a particular span of time, wick and tail, the vertical lines above and below the body, indicate the highest and lowest value of stock in that time span respectively. Being packed with so much information in a single chart, these charts are used in tracking the price movements of stock. |
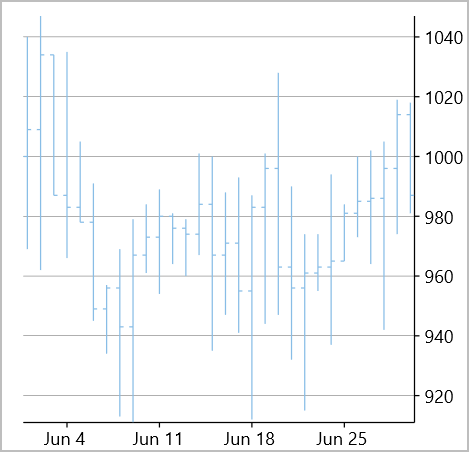
| HighLowOpenClose (HLOC) | Like Candlestick charts, HighLowOpenClose charts or HLOC charts are also used to plot high, low, open and close values of stocks in a specified time frame and are used for stock analysis. The only difference from a candlestick chart is that the HLOC charts are drawn without candlestick 'body'. |
Create a Financial Chart
With FlexChart, you can create Candlestick or HLOC chart by setting the ChartType property of the FlexChart class to Candlestick or HighLowOpenClose, similar to the basic charts. This property accepts the values from ChartType enumeration. In addition to setting the chart type, you can also change the size of the candle or symbols in HLOC chart by setting the SymbolSize properties of the series.
To create a HLOC or candlestick chart through code, you need to configure the X and Y axes by setting the BindingX and Binding properties, respectively. Then set up the chart by setting the ChartType property and other required properties.
In the following example, we configure the Y axes by setting Binding property as showcased in the following code:
<c1:FlexChart x:Name="flexChart"
           ChartType="HighLowOpenClose"
           ItemsSource="{Binding Data}"
           Binding="High,Low,Open,Close" BindingX="Date">
    <c1:FlexChart.AxisY>
        <c1:Axis Position="Right" MajorGrid="True" />
    </c1:FlexChart.AxisY>
    <c1:Series SymbolSize="6"></c1:Series>
</c1:FlexChart>
Following C# code is required to create the Financial chart:
public partial class FinancialCharts : ContentPage
{
    DataService dataService = DataService.GetService();
    public FinancialCharts()
    {
        InitializeComponent();
    }
    List<Quote> _data;
    public List<Quote> Data => _data != null ? _data : _data = dataService.CreateFinancialData(DateTime.Today, 30);
}
public class Quote
{
    public DateTime Date { get; set; }
    public double Open { get; set; }
    public double Close { get; set; }
    public double High { get; set; }
    public double Low { get; set; }
    public double Volume { get; set; }
}
public class DataService
{
    static Random rnd = new Random();
    static DataService _ds;
    public static DataService GetService()
    {
        if (_ds == null)
            _ds = new DataService();
        return _ds;
    }
    public List<Quote> CreateFinancialData(DateTime start, int days)
    {
        List<Quote> list = new List<Quote>();
        var dt = start;
        for (var i = 0; i < days; i++)
        {
            var q = new Quote();
            q.Date = dt.AddDays(i);
            if (i > 0)
                q.Open = list[i - 1].Close;
            else
                q.Open = 1000;
            q.High = q.Open + rnd.Next(50);
            q.Low = q.Open - rnd.Next(50);
            q.Close = rnd.Next((int)q.Low, (int)q.High);
            q.Volume = rnd.Next(0, 100);
            list.Add(q);
        }
        return list;
    }
}