
Axis Labels
Axis labels are the text referring to major divisions which appear along an axis. On a category axis, axis labels display category names, while those on a value axis display values. FlexChart, by default, automatically generates the axis labels for both axes depending on the data and displays or hides them according to the available space along the axis line. However, you can set the chart to display axis labels for the maximum and minimum values always while automatic generation and placement, by setting the LabelMax and LabelMin properties respectively to True.
By default, the LabelMax property displays the maximum axis value.You can also choose to hide all the labels of a particular axis by setting the Labels property of Axis class to False. FlexChart also lets you position the data labels with respect to the tick marks on the axis by setting the LabelAlignment property.
Manage Overlapping Axis Labels
Overlapping of axis labels, generally, occurs due to long axis label text or a large number of data points plotted on a chart. With FlexChart, you get many options to manage your axis labels. You can choose any of them according to the chart data and your requirement.
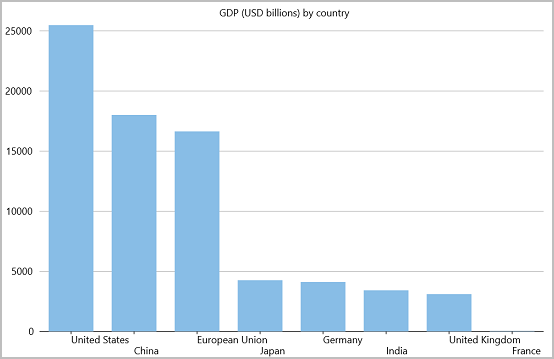
By default, FlexChart automatically places the axis labels and hides the overlapping labels if the space does not allow to display them. However, FlexChart provides various options to handle the overlapping labels through the OverlappingLabels property of Axis class, which is set to Auto, by default. This property is responsible for hiding the overlapping axis labels and also lets you show, trim or wrap the labels in the case of overlapping using the OverlappingLabels enumeration. Furthermore, staggering the axis labels is another effective method of managing the overlapping axis labels. This way, you can arrange the axis labels in multiple lines so that they do not overlap and yet be visible. This can be done by setting value of the StaggeredLines property to a value greater than 1, which is default value of the property.
<c1:FlexChart x:Name="flexChart" ItemsSource="{Binding Data}" BindingX="Country"
Header="GDP (USD billions) by country" ToolTipContent="{}{Country}
{y:n0}">
<c1:FlexChart.AxisX>
<c1:Axis BindingContext="{Binding Source={x:Reference flexChart},Path=BindingContext}"
StaggeredLines="2" LabelAlignment="Left" OverlappingLabels="Trim" />
</c1:FlexChart.AxisX>
<c1:Series Binding="Gdp" />
</c1:FlexChart>
The following code provides data for the chart showcasing overlapping labels:
public object[] Data => GdpData.GetData();
class GdpData
{
    public static object[] GetData()
    {
        return new object[]
        {
            new { Country = "United States", Gdp = 25462.700 },
            new { Country = "China", Gdp = 17963.171 },
            new { Country = "European Union", Gdp = 16600.000 },
            new { Country = "Japan", Gdp = 4231.141 },
            new { Country = "Germany", Gdp = 4072.192 },
            new { Country = "India", Gdp = 3385.090 },
            new { Country = "United Kingdom", Gdp = 3070.668 },
            new { Country = "France", Gdp = 2.782905 }
        };
    }
}
Alternatively, overlapping axis labels can be handled by rotating the labels with respect to the axis line by setting the LabelAngle property. This property accepts the numerical values from -90 to 90 in degrees and rotates the axis labels by the specified angle in anti-clockwise direction, thus giving it a more aesthetic look.
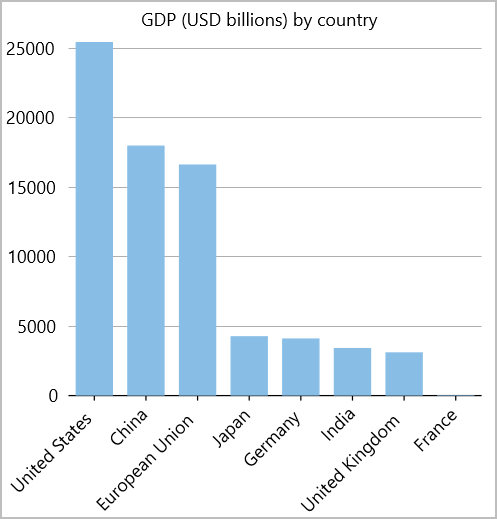
The following code demonstrates how to manage overlapping labels by rotating the X Axis label. This code uses the same chart and data used in the above code.
<c1:FlexChart x:Name="flexChart" ItemsSource="{Binding Data}" BindingX="Country"
Header="GDP (USD billions) by country" ToolTipContent="{}{Country}
{y:n0}">
<c1:FlexChart.AxisX>
<c1:Axis BindingContext="{Binding Source={x:Reference flexChart},Path=BindingContext}"
LabelAngle="45"/>
</c1:FlexChart.AxisX>
<c1:Series Binding="Gdp" />
</c1:FlexChart>