
Multiple Axes
Although a chart contains primary X and Y axes, you may still sometimes require additional axes to fulfill your requirements. For example, you may want to plot series of a significantly different range of values in a chart. In addition, you may want to plot entirely different values (of different types) within a single chart. With just two axes, it would not be possible to display data in such scenarios effectively. In such cases, using secondary axes would come in handy. To use secondary axes, you can plot multiple series in a single chart with their own X and Y axes.
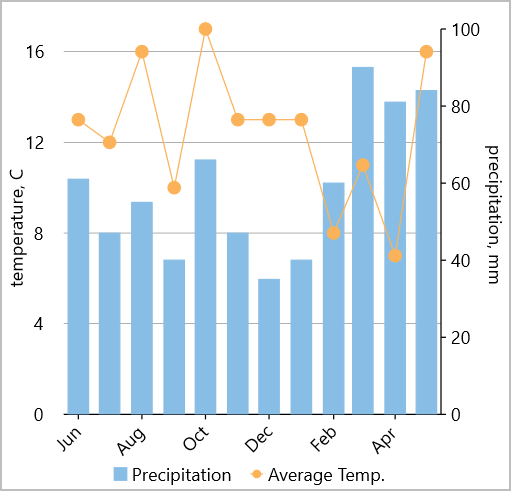
FlexChart allows you to add secondary axes when you add multiple series to the chart. The scale of a secondary axis represents the values of its associated series. You can even change the ChartType of the associated series to easily identify the values plotted along the secondary axis.
The following image shows two Y axes, one primary and another auxiliary, along with X axis in FlexChart.
The following code example demonstrates how to add two Y axes to the FlexChart.
<c1:FlexChart x:Name="chart" ItemsSource="{Binding Data}" BindingX="Time"
 LegendPosition="Bottom" >
    <c1:Series SeriesName="Precipitation" Binding="Precipitation">
        <c1:Series.AxisY>
            <c1:Axis Position="Right" Min="0" Max="100" Title="precipitation, mm" MajorGrid="False"/>
        </c1:Series.AxisY>
    </c1:Series>
    <c1:Series SeriesName="Average Temp." ChartType="LineSymbols" Binding="Temperature">
        <c1:Series.AxisY>
            <c1:Axis Title="temperature, C" Min="0" MajorGrid="True" AxisLine="False" Position="Left" MajorTickMarks="None" />
        </c1:Series.AxisY>
    </c1:Series>
    <c1:FlexChart.AxisX>
        <c1:Axis BindingContext="{Binding Source={x:Reference chart},Path=BindingContext}"
             LabelAngle="45"/>
    </c1:FlexChart.AxisX>
</c1:FlexChart>
The following code demonstrates the data used in the above chart.
List<DataItem> _data;
Random rnd = new Random();
int npts = 12;
public TwoYAxes()
{
    InitializeComponent();
}
public List<DataItem> Data
{
    get
    {
        if (_data == null)
        {
            _data = new List<DataItem>();
            var dt = DateTime.Today;
            for (var i = 0; i < npts; i++)
            {
                _data.Add(new DataItem()
                {
                    Time = dt.AddMonths(i),
                    Precipitation = rnd.Next(30, 100),
                    Temperature = rnd.Next(7, 20)
                });
            }
        }
        return _data;
    }
}
public class DataItem
{
    public DateTime Time { get; set; }
    public int Precipitation { get; set; }
    public int Temperature { get; set; }
}