
Powerful JavaScript Chart Components for Modern Data Visualization
Wijmo FlexChart delivers over 80 fast, lightweight JavaScript chart components for building modern data visualizations. With flexible chart types, smooth interactivity, and customizable styling, developers can create professional dashboards, while end-users enjoy responsive charts with features like tooltips, filtering, and drilldowns.
- Choose from bar, line, area, scatter, pie, and financial charts, plus advanced options, like grouping and drilldown, for deeper insights.
- Enable selection, filtering, tooltips, hit-testing, and line markers to create dynamic, user-friendly data visualizations.
- Use CSS or programmatic styling, conditional formatting, and annotations to highlight trends and important data points.
- Support for all major frameworks, including Angular, React, Vue, Vite, and Svelte
Try Out One of 80+ Dynamic JavaScript Chart Components
A JavaScript chart component is a high-performance control to visualize data in web applications. FlexChart is a JavaScript chart component with a rich UI gallery of 80+ charts and graphs, ranging from line to financial, catering to all charting scenarios.
| JavaScript Chart Quick Start Guide | |
|---|---|
| 1. Install from npm | npm install @mescius/wijmo.purejs.all |
| 2. Declare chart markup | <div id="hostElement"></div> |
| 3. Import and initialize chart module |
import * as wjChart from ‘@mescius/wijmo.chart’; let chart = new wjChart.FlexChart('#hostElement'); |
Learn more with our complete quick start guide for FlexChart
Popular JavaScript Chart Components
Custom Tooltips
FlexChart gives you complete control over tooltip customization by enabling rich HTML templating. Easily embed custom HTML content, apply conditional styling, and dynamically bind data, ensuring your tooltips deliver clear information to users interacting with your charts.


Series Picker
With FlexChart, you can easily add an interactive Series Picker using Wijmo’s popup functionality. Enable users to quickly toggle visibility for individual chart series, making it easy for them to focus on the most relevant data at any given moment.
Editable Annotations
FlexChart provides support for editable annotations, allowing users to add, modify, and reposition notes, shapes, and images directly on the chart. Enhance user interactions and clearly highlight key insights by offering in-place editing and customization capabilities.


Export and Share
FlexChart makes exporting and sharing your charts seamless. Easily save visualizations in popular formats like PNG, JPEG, and SVG, and quickly export chart data to CSV. Empower your users to effortlessly share insights and integrate visuals into reports or presentations.
All JavaScript Chart Components

Bar Charts

Bar Stacked Charts
Stack data points in a JavaScript bar chart. Plots data points on top of each other using horizontal bars.

Bar Stacked 100 Charts
Compare the percentages each value contributes to the total. The cumulative proportion of each stacked column always totals one hundred.

Column Charts
Similar to a bar chart, with a primarily vertical orientation. JavaScript column charts compare values across categories by using vertical bars.
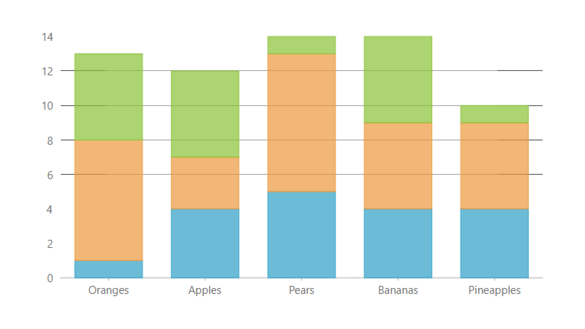
Column Stacked Charts
Stack and plot data points in a column chart using vertical bars. To stack the chart values, set the FlexChart stacking property.
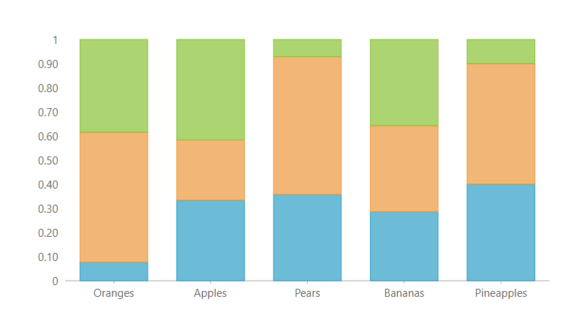
Column Stacked 100 Charts
The cumulative proportion of each stacked column always totals one hundred. Compare the percentages each value contributes to the total.

Bar Charts
Bar Charts present data using horizontal bars, ideal for comparing categories with long labels or emphasizing rank and magnitude. They offer intuitive interactivity with animated transitions, series stacking, selection, and rich tooltips on hover. Flip the axis of a column chart to gain clearer visual insight into your data—all with seamless performance and customization.

Bar Stacked Charts
Bar Stacked charts visualize cumulative values across categories using horizontally stacked bars. Ideal for comparing part-to-whole relationships, they layer series data efficiently along a horizontal axis. Customize stacking behavior with the stacking property, and easily reverse the Y-axis for a more intuitive top-down view—perfect for dashboards, performance metrics, and distribution insights.

Bar Stacked 100 Charts
Bar Stacked 100 Charts display relative percentage contributions across categories using horizontal bars that always total 100%. Perfect for visualizing part-to-whole relationships, they transform raw values into proportional insights. Set the stacking property to enable stacking, and reverse the Y-axis for a more intuitive, top-down layout when comparing normalized data.

Column Charts
Column Charts present data with vertical bars to compare values across categories with clarity and precision. Ideal for showcasing trends or grouped data, they support multiple data series, enabling side-by-side comparisons. Each column rises from the X-axis, with height mapped to Y-axis values—making insights into performance or distribution instantly visible.

Column Stacked Charts
Column Stacked Charts stack multiple data series into a single vertical column, making it easy to visualize how individual values contribute to a total. Ideal for cumulative comparisons across categories, it uses the stacking property to align values vertically. Reverse the Y-axis for a natural top-down perspective that enhances readability.

Column Stacked 100 Charts
Column Stacked 100 Charts visualize part-to-whole relationships by stacking series values as percentages within vertical columns that always total 100%. Ideal for comparing proportional contributions across categories, this chart highlights relative impact at a glance—making complex data instantly understandable without focusing on absolute values.
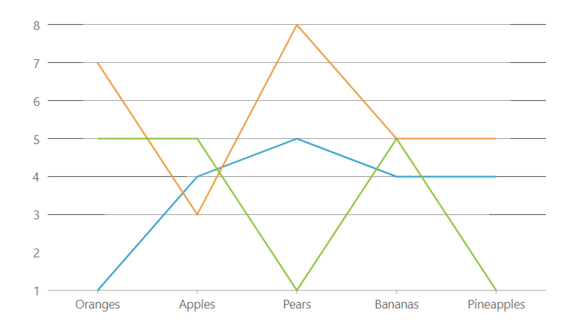
Line Charts
Display changes in data over short and long periods of time with a basic JavaScript line chart and works well with large amounts of data.
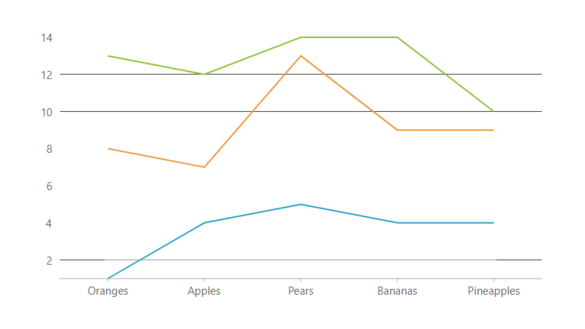
Line Stacked Charts
Stack series in a line chart. A stacked line chart is a line chart in which lines do not overlap because they are cumulative at each point.
StepLine Charts
StepLine Charts help visualize changes at a specific point. Data points are connected through vertical and horizontal lines.
Spline Charts
Spline charts connect the data points with smooth lines and use numeric, category, datetime, or logarithmic axis to plot data.

Area Charts
Represent time-dependent data to reflect trends at equal intervals, but it fills the area below the line to demonstrate trends in similar categories.

Range Area Charts
Fill in the area below the line to demonstrate trends in similar categories. Shows variations in the data values for a given time.

Line Charts
Line Charts are ideal for tracking trends and fluctuations over time, whether across days or decades. Designed for performance, they handle large datasets with ease while supporting multiple series for easy comparisons. Customize with markers, animations, and interactivity to build variations that suit everything from financial dashboards to real-time monitoring.

Line Stacked Charts
Line Stacked Charts let you visualize cumulative trends over time by stacking multiple series, ensuring lines never overlap. Ideal for showcasing contributions to a total—like direct and indirect sales—it supports interactive features like symbols and Line Markers. Easily toggle visibility on hover for dynamic, data-rich storytelling in real-time or historical views.

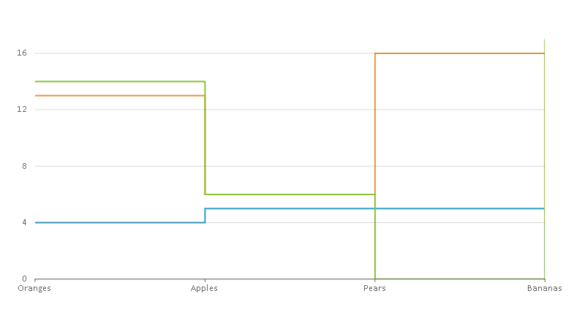
StepLine Charts
StepLine Charts highlight data changes at precise intervals using sharp 90-degree angles that connect points with vertical and horizontal lines. Ideal for tracking shifts in state or discrete jumps in value, customizable step positions—start, center, or end—are determined through the options property for tailored visual storytelling in time-series data.

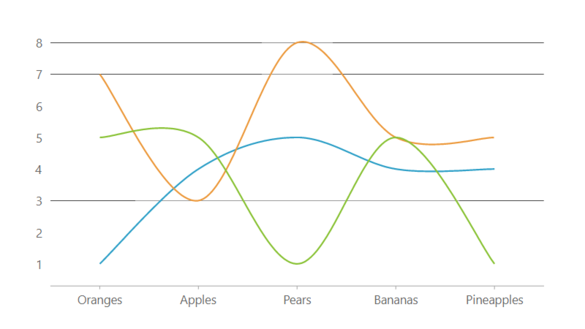
Spline Charts
Spline Charts connect data points with elegant, flowing curves for a polished, easy-to-read visualization. Using line smoothing algorithms, it transforms jagged data into graceful arcs—ideal for highlighting trends over numeric, category, datetime, or logarithmic axes. Whether for clarity or visual appeal, Spline Charts add refinement to any data story.

Area Charts
Area Charts visualize trends over time or categories by filling the space beneath the line, creating a clear sense of volume and magnitude. Blending features from bar and line charts, it supports smoothing, stepping, stacking, vertical orientation, and range variations—making it a versatile choice for layered insights and time-based comparisons.

Range Area Charts
Range Area Charts display the span between two data series, filling the space in between to visualize value fluctuations over time or categories. Perfect for showcasing highs and lows, they use raw data to calculate dynamic ranges. Customize appearance via the series and style properties for clear, insightful trend analysis.
Scatter Charts
Demonstrate correlation between data points and a set of numerical data along the x-axis and the y-axis. The Scatter Chart combines values into single data points and displays uneven intervals or clusters.
Bubble Charts
Create rich, visually appealing data modeling and financial charts with bubble charts. This JavaScript Flexchart type allows you to display your data series as a set of differently-sized symbols in the chart space.
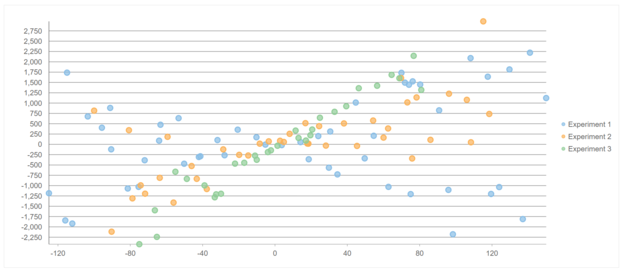
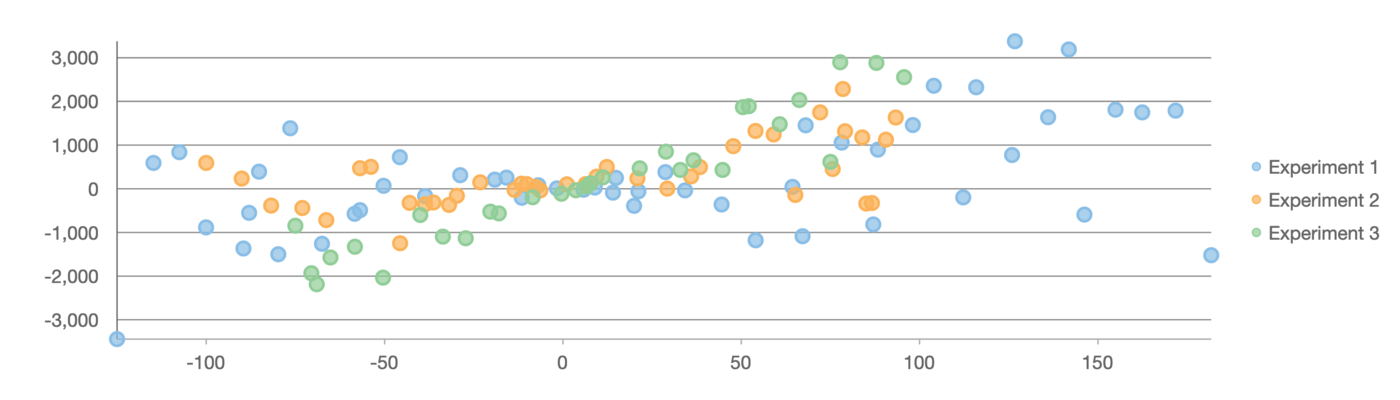
Scatter Charts
Scatter Charts plot individual data points along numeric X and Y axes to reveal patterns, clusters, and correlations—ideal for scientific, statistical, or engineering data. Perfect for irregular intervals, they handle dense datasets with precision, allowing multiple data sources per series using itemsSource and bindingX to minimize reprocessing for complex datasets.
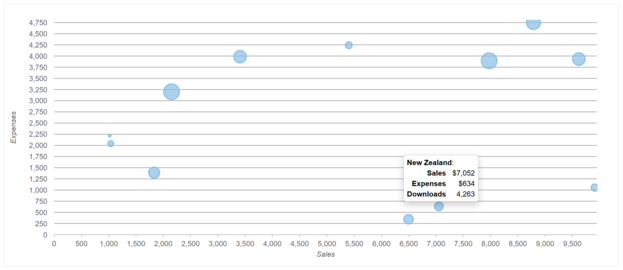
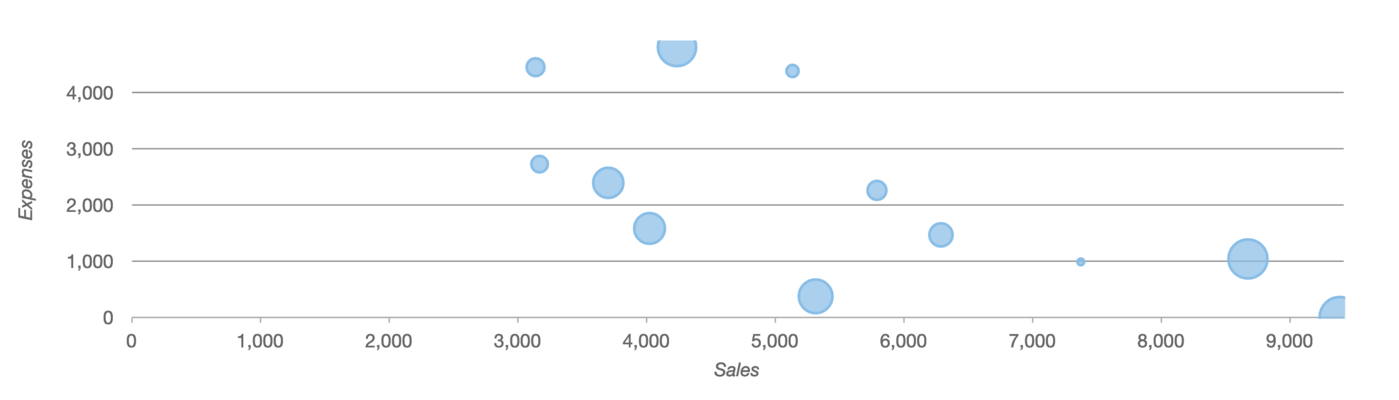
Bubble Charts
Bubble Charts visualize three-dimensional data by scaling each data point as a bubble, where position reflects X and Y values and size represents a third (Z) dimension. Ideal for financial analysis and data modeling, they transform standard scatter plots into rich, interactive visuals that reveal depth, distribution, and influence at a glance.

Candlestick Chart
Visualize financial data in the Candlestick Chart. The vertical bar spans the High and Low values for the day.

HLOC Charts
Also known as high low open close, HLOC illustrates movements in the price of a financial instrument over time.

Candlestick Chart
Candlestick Charts deliver a powerful visualization of financial market data, plotting daily stock performance with open, high, low, and close values. Each candle captures price movement over time, making it essential for analyzing trends, volatility, and reversals in securities, derivatives, or currencies—ideal for traders, analysts, and financial dashboards.

HLOC Charts
HLOC (High-Low-Open-Close) Charts visualize financial price movements with precision. Similar to candlestick charts, they map high and low values vertically, while left and right ticks mark open and close prices. Ideal for tracking trends in stocks, currencies, or derivatives, HLOC charts offer a clean, data-rich view of market activity over time.

Pie Chart
JavaScript pie charts show how parts of a whole add up to 100%. Features include exploding slices, pie slice selection, and pie rotation.

Donut Charts
Set the inner radius property of the JavaScript pie chart to turn it into a doughnut. Includes all of the pie chart customizations.

Sunburst Charts
Visualize hierarchical data from a root node (center) outward to lower hierarchies. A segment of the inner circle is a parent to the segments of the outer circle that lie within the parent's angular sweep.

Multiple Pie Charts
Use FlexPie to visualize more data in a single chart by creating multiple pie chart "series" using the same data source. An effective way of presenting data, especially if the intent is to show one section relative to the whole.

Pie Chart
Pie Charts visualize part-to-whole relationships with intuitive, circular clarity—each slice representing a percentage of a complete 100%. Enhance interactivity with features like slice explosion, selection, and rotation for a dynamic, engaging experience. These are ideal for showcasing distribution, proportions, or survey results in dashboards, reports, and data visualizations.

Donut Charts
Donut Charts offer a stylish twist on the classic pie chart by adding a customizable center hole using the innerRadius property. They include all the interactive features of Pie Charts—exploding slices, rotation, selection—plus flexible data label positioning via DataLabel.position. These charts are perfect for visualizing part-to-whole data with a modern, readable design.

Sunburst Charts
Sunburst Charts visualize hierarchical data in a radial layout, expanding from a central root node to outer layers of child segments. Each ring represents a level in the hierarchy, with angular slices denoting relationships and size. They are ideal for illustrating organizational structures, file systems, or nested categories with clarity and visual impact.

Multiple Pie Charts
Multiple Pie Charts let you display several pie chart series from a single data source—ideal for comparing multiple categories relative to a whole. Using FlexPie with comma-separated binding properties, you can generate side-by-side visuals that highlight distribution patterns across datasets, making complex insights easy to grasp at a glance.

Radar Line Charts
Display multivariate observations with an arbitrary number of variables. A JavaScript radar chart visualizes data in terms of values and angles.
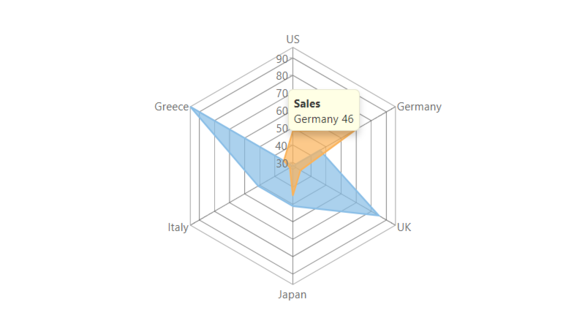
Radar Filled Charts
Visualize data in terms of values and angles with the Fill in the areas between lines of a primary radar chart, The FlexRadar control fills the chart section, set the chart type property to area.

Polar Charts
Create circular graphs to display multivariate observations with an arbitrary number of variables. Visually compare several quantitative or qualitative aspects of a situation.

Radar Line Charts
Radar Line Charts visualize multivariate data using a circular layout where each axis represents a category. Data points are plotted by angle and value, then connected to reveal patterns across multiple variables. Ideal for performance comparisons, skill assessments, or survey results, this chart makes complex datasets visually intuitive and engaging.

Radar Filled Charts
Radar Filled Charts enhance traditional radar charts by filling the space between data lines, highlighting differences across multiple series. Built with the FlexRadar control and set to chartType: Area, it visualizes values and angles in a bold, intuitive format—perfect for comparing multivariate data like performance metrics, competencies, or market analysis.

Polar Charts
Polar Charts display multivariate data on a circular graph, plotting values based on angles from 0 to 360 degrees. Ideal for visualizing patterns, trends, or relationships across multiple variables, they offer a clear, intuitive view of both quantitative and qualitative data—perfect for comparisons in scientific, engineering, or analytical contexts.

BreakEven Chart
A break-even chart shows the sales volume level at which total costs equal sales. The chart plots revenue, fixed costs, and variable costs on the vertical axis, and volume on the horizontal axis.

Grouped TreeMap Charts
Display hierarchical information combined with relative quantity. Highlight hierarchical, tree-structured data as a set of nested rectangles and help to analyze the anomalies in the data set.

ErrorBar Charts
Graphically represents the variability of data to indicate the uncertainty in a measurement. The “error” isn't a mistake, but a range of data that represents a built-in uncertainty.

Funnel Charts
Visualize stages of the process in a funnel shape, such as for sales. Plots streamlined data to show various stages in a process. Adjust the funnel's height, width, and style using the options property.

Waterfall Charts
Show change in the starting position of the chart through a series of changes. A waterfall chart is a form of data visualization that helps understand the cumulative effect of sequentially introduced positive or negative values.

Funnel Rectangle Charts
Square the edges in a funnel for a different look that plots streamlined data to show various stages in a process. Use a funnel chart to show the number of sales prospects for each stage in the sales funnel.

Box-and-Whisker Charts
Visualize a group of numerical data through their quartiles (box plot). Box plots may also have lines extending vertically from the boxes (whiskers), indicating variability outside the upper and lower quartiles.

Gantt Charts
Manage a project with a Gantt chart and never miss a step. Includes dependencies and percent complete, start and end dates for each task, and information such as completion states and task dependencies.

BreakEven Chart
BreakEven Charts visualize the critical point where total revenue meets total costs, helping businesses identify the minimum sales volume needed for profitability. By plotting revenue, fixed costs, and variable costs vertically against sales volume horizontally, they deliver a clear view of financial thresholds—essential for forecasting, pricing strategy, and cost analysis.

Grouped TreeMap Charts
Grouped TreeMap Charts visualize hierarchical data using nested rectangles, combining structure with relative quantity. Enable users to more easily spot patterns or anomalies by using the binding property to size nodes by value and bindingName to label them. With intuitive data binding similar to FlexPie, Grouped TreeMap charts are perfect for analyzing complex, tree-structured datasets.

ErrorBar Charts
ErrorBar Charts visualize the uncertainty or variability within data by adding error bars to your series. Whether showing standard error, percentage, or standard deviation, they highlight margins of error at a glance. Use the ErrorBar class to seamlessly extend the standard Series class, bringing clarity to scientific, financial, or analytical datasets.

Funnel Charts
Funnel Charts visualize sequential stages in a process—like a sales pipeline—using tapered bars that represent diminishing values. Ideal for tracking conversion, drop-off, or workflow progression, it plots data in a streamlined funnel shape. Easily customize height, width, and style using the options property for clear, impactful process insights.

Waterfall Charts
Waterfall Charts illustrate how sequential gains and losses impact a starting value, revealing cumulative change over time. Often called a “flying bricks” or Mario chart, it uses floating columns and optional connector lines to clarify each step. Highlight intermediate or final totals with the showTotal property for deeper financial or operational insights.

Funnel Rectangle Charts
Funnel Rectangle Charts offer a modern take on traditional funnel visualizations by replacing tapered segments with clean, stacked rectangles. Ideal for sales pipelines or process flows, they clearly display each stage without visual distortion. Perfect for comparing drop-off rates or stage counts, this chart brings clarity and structure to streamlined data.

Box-and-Whisker Charts
Box-and-Whisker Charts (boxplot) visualize numerical data distribution through quartiles, with “whiskers” indicating variability beyond the upper and lower bounds. Highlight mean, median, outliers, and inner points for deeper statistical insights. Customize appearance using properties like showOutliers, showMeanLine, and rotated for clear, detailed analysis in scientific, financial, or survey data.

Gantt Charts
Gantt Charts helps you manage projects with precision by visualizing tasks as horizontal bars across a timeline. Display start and end dates, completion status, and task dependencies all in one view. Customize formatting with gantItemFormatter() and event handling via ganttChartRendered() to keep complex schedules clear, connected, and on track.
Featured Blogs, Videos, and Other Resources


Wijmo's Customer Feedback & Awards

"Good value for money and high quality components"
RICHARD HERBERT
"Great tools, not cheap, but worth the money for us."
TRUSTED CUSTOMER
"I've been using Wijmo controls for about a year and a half. Fantastic product. Fantastic support!"
TRUSTED CUSTOMER
 |
 |

"I don’t give kudos lightly, and without merit, but the Wijmo team has been awesome to work with. Just amazingly responsive! I am so glad I recommended Wijmo to my partners."
GABOR FARI, PARTNER TECHNOLOGY STRATEGIST - MICROSOFT CORP
"With Wijmo's extensibility model, the Microsoft Dynamics team was able to quickly customize and incorporate Wijmo 5 components into our new release."
PARAM KAHLON, GENERAL MANAGER, MICROSOFT DYNAMICS CRM ENGINEERING

"We rely on functionality of Wijmo Core's FlexGrid in our massive next-generation platform products. >Wijmo's modern, full-featured FlexGrid with sophisticated grid manipulations is what you will find at the heart of our workflow."
AARON MENDEZ, MANAGER OF THE USER EXPERIENCE, THOMSON REUTERS
Trusted by the World's Leading Companies
