Flexible JavaScript Pivot Grids and Charts for Interactive Data Analysis
Wijmo OLAP provides powerful JavaScript Pivot Grids and Charts that let users quickly summarize, slice, and visualize complex datasets. With drag-and-drop pivot panels, customizable layouts, and built-in charting, developers can deliver interactive, enterprise-ready analytics experiences.
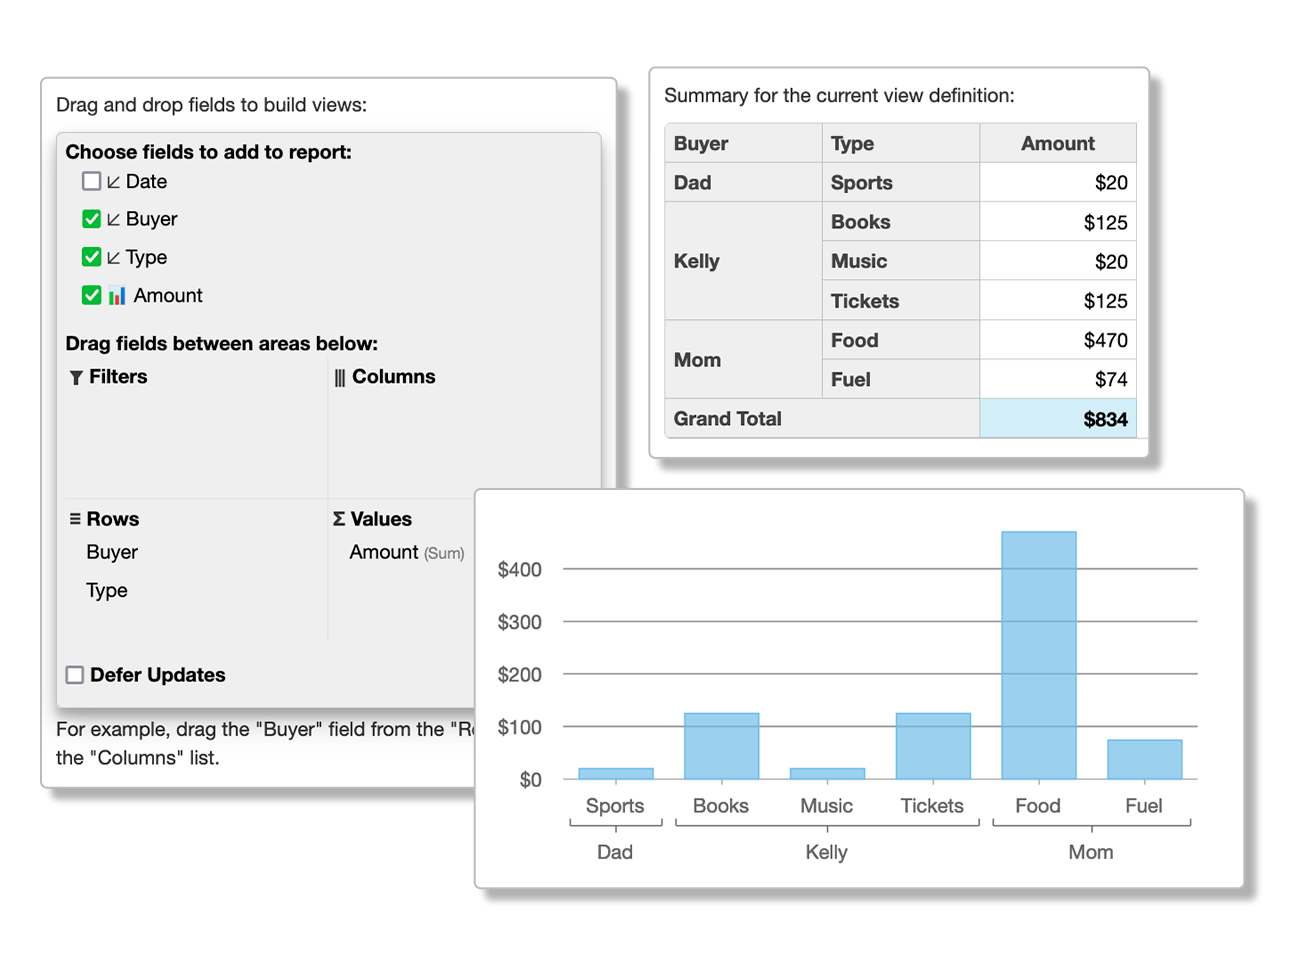
- Easily configure fields, filters, and values to create custom pivot views
- Support for sorting, grouping, conditional formatting, detail dialogs, and the ability to export to Excel or PDF
- Visualize aggregated data in dynamic charts with instant updates as layouts change
- Connect your Microsoft SSAS cubes directly to Wijmo's OLAP controls
Try Our Excel-Like Pivot Grids and Charts
JavaScript OLAP (Online Analytical Processing) is a powerful technology behind many Business Intelligence (BI) applications. It assists users in tasks such as data discovery, performing complex analytical calculations and predictive "what if" scenarios, budget planning, and forecast planning.
| JavaScript OLAP Component Quick Start Guide | |
|---|---|
| 1. Install from npm | npm install @mescius/wijmo.purejs.all |
| 2. Declare OLAP markup |
<div id=”paneltElement”></div> <div id=”gridElement”></div> <div id=”chartElement”></div> |
| 3. Import and initialize OLAP module |
import * as wjcOlap from ‘@mescius/wijmo.olap’; var panel = new wjcOlap.PivotPanel('#panelElement'); var grid = new wjcOlap.PivotGrid('#gridElement'); var chart = new wjcOlap.PivotChart('#chartElement'); |
Learn more with our complete quick start guide for OLAP Pivot Grid
JavaScript OLAP Component Highlights
Customizing Cells
Wijmo’s JavaScript PivotGrid control allows you to heavily customize the look, feel, and functionality of every cell within the pivot grid to match your requirements. You can set up conditional styles, add custom components and sparklines, and dynamically update cells in real time with the PivotGrid.


Outline Mode
The PivotGrid control enables you to render row fields in an outline format, similar to what Excel provides with its pivot grids. Outline mode is more compact and reduces the amount of whitespace displayed on the screen.
Visualize Dynamic Summaries with PivotChart
Wijmo’s JavaScript PivotChart control displays different charts that visualize data summaries generated by the PivotEngine component. It extends both FlexChart and FlexPie controls, providing access to all the features of your chosen chart type.


Export Content to Excel, PDF, CSV, and Images
Both PivotGrid and PivotChart support exporting their content to various formats. The PivotGrid control enables users to export their data to XLSX, CSV, or PDF, while the PivotChart control allows users to export their charts as PNG, JPEG, or SVG images.
JavaScript OLAP Component Key Features

OLAP Outline Mode
Compact, Excel-like outline rendering of row fields, minimizing whitespace and enhancing readability in pivot grids.

Smart PivotPanel
Excel-like drag-and-drop field panel with intelligent placements and view persistence (save/load), boosting UX efficiency.

PivotGrid
Advanced pivot grid with hierarchical headers, collapsible groups, drill-down support, and editable field context menus.

PivotChart
PivotChart displays summaries as dynamic charts with hierarchical axes, supporting FlexChart and FlexPie features.

Slicer Control
Interactive slicer control for intuitive visual filtering, highlighting current filter states in PivotGrids and PivotCharts.

Hierarchical & Auto-Generated Fields
Auto-generate and hierarchically organize fields (e.g., year/quarter/month groups), improving navigation of large datasets.

OLAP Outline Mode
Wijmo’s OLAP Outline Mode presents row fields in a compact, hierarchical outline format, similar to Excel pivot grids, which reduces unnecessary padding and makes complex data sets more accessible. This streamlined design enhances visual clarity, particularly with deeply nested or large data structures, allowing users to focus on the data rather than navigating cluttered layouts.
Smart PivotPanel
The Smart PivotPanel offers an intuitive, Excel-style experience—letting users drag fields into row, column, value, and filter zones. The panel intelligently interprets data types to auto-place fields and supports saving and loading view configurations. It even allows reusing the same field multiple times with different aggregations. Asynchronous processing and progress UI ensure smooth performance when working with large datasets.
PivotGrid
Built upon the FlexGrid, the PivotGrid brings hierarchical row and column headers, collapsible subtotals, and in-cell drill-down capabilities. Users can uncover underlying data seamlessly and right-click to open context menus for editing field properties. These interactive controls ensure data exploration is both powerful and intuitive—perfect for developer dashboards and analyses.
PivotChart
The PivotChart transforms pivot-engine summaries into rich visualizations—leveraging FlexChart or FlexPie controls with hierarchical axes that mirror the structural complexity of your pivot data. Developers gain access to flexible chart types and full chart-level functionality, allowing end users to explore insights visually, with depth and clarity tailored to their analysis needs.
Slicer Control
The Slicer control empowers users to filter data by selecting values in a visual interface, with clear indicators of the current filter state. This Luminous, user-friendly control enables dynamic, on-the-fly adjustments to what’s displayed in both PivotGrid and PivotChart components—making interactive exploration effortless and highly intuitive.
Hierarchical & Auto-Generated Fields
With automatic field generation, PivotEngine helps developers scaffold fields based on dataset structure. Define fields explicitly or create hierarchical groupings—e.g., Dates split into Year, Quarter, and Month, or grouped under meaningful categories—making it far easier for users to navigate extensive field libraries. Hierarchical groups in the PivotPanel simplify UI complexity and boost discoverability.

Client-Side OLAP Engine
Lightweight, blazing-fast client-side engine that processes pivot summaries for hundreds of thousands of records directly in the browser—no server required.

Microsoft SSAS Cube Integration
Seamless integration with Microsoft SSAS OLAP cubes—bind directly via URL and cube name, no additional server infrastructure needed.

Server-Side OLAP Support
Optional server-side processing via ComponentOne Web API or DataEngine Services—offloading heavy aggregation for huge datasets.
Client-Side OLAP Engine
Wijmo’s PivotEngine enables ultra-responsive pivot grid and chart processing entirely on the client. It handles sizable datasets—typically up to hundreds of thousands of rows—with aggregated summaries generated asynchronously in milliseconds, preserving UI responsiveness. This means developers can deliver lightning-fast BI experiences without server dependencies, perfect for moderately large or pre-filtered datasets where delivering raw data to the client remains practical.
Microsoft SSAS Cube Integration
For teams with existing SQL Server Analysis Services (SSAS) infrastructure, Wijmo provides a direct connection—simply configure the itemsSource object with the cube URL and name to bind your PivotEngine to the SSAS cube. This approach bypasses the need for a server-side API and scales effortlessly to datasets of virtually any size, while maintaining the full interactivity of Wijmo’s OLAP UI. Support for optional Basic Authentication (user, password, catalog) is available for secure environments.
Server-Side OLAP Support
When dealing with massive data volumes—millions of records—Wijmo’s OLAP can leverage server-side execution using the ComponentOne Web API or high-performance DataEngine Services. By routing aggregation, filtering, and sorting to backend services via a service URL in itemsSource, this setup minimizes client payload and maximizes performance. Ideal for enterprise-scale data scenarios, it requires installation and licensing of server components, typically bundled with ComponentOne Ultimate.

Customizable Cells
Fully customize PivotGrid cells with conditional styles, sparklines, or embedded components to deliver interactive, branded, and data-rich presentations.

Exporting Content
Export pivot data and visuals seamlessly to Excel, CSV, PDF, or image formats for easy sharing and reporting.
Customizable Cells
Wijmo’s PivotGrid gives developers complete control over cell rendering. Apply conditional formatting to highlight trends, insert inline sparklines to show micro-visuals, or embed custom components for interactive dashboards. This flexibility ensures that data isn’t just displayed—it’s communicated clearly and aligned with your application’s design language. Whether emphasizing outliers, visualizing growth, or integrating interactive widgets, developers can tailor cells to maximize clarity and user engagement.
Exporting Content
Wijmo’s OLAP controls simplify reporting with robust export capabilities. PivotGrid supports direct export to XLSX, CSV, and PDF, while PivotChart allows exporting to high-quality PNG, JPEG, or SVG formats. These export features integrate seamlessly into workflows, allowing teams to share insights, archive data snapshots, or generate polished reports. Developers can empower end users to capture both tabular and charted data for analysis outside the app, ensuring flexible reporting that meets diverse business needs.
Featured Blogs, Videos, and Other Resources


Wijmo's Customer Feedback & Awards

"Good value for money and high quality components"
RICHARD HERBERT
"Great tools, not cheap, but worth the money for us."
TRUSTED CUSTOMER
"I've been using Wijmo controls for about a year and a half. Fantastic product. Fantastic support!"
TRUSTED CUSTOMER
 |
 |

"I don’t give kudos lightly, and without merit, but the Wijmo team has been awesome to work with. Just amazingly responsive! I am so glad I recommended Wijmo to my partners."
GABOR FARI, PARTNER TECHNOLOGY STRATEGIST - MICROSOFT CORP
"With Wijmo's extensibility model, the Microsoft Dynamics team was able to quickly customize and incorporate Wijmo 5 components into our new release."
PARAM KAHLON, GENERAL MANAGER, MICROSOFT DYNAMICS CRM ENGINEERING

"We rely on functionality of Wijmo Core's FlexGrid in our massive next-generation platform products. >Wijmo's modern, full-featured FlexGrid with sophisticated grid manipulations is what you will find at the heart of our workflow."
AARON MENDEZ, MANAGER OF THE USER EXPERIENCE, THOMSON REUTERS
Trusted by the World's Leading Companies
