PivotGrid
The PivotGrid displays data summaries generated by PivotEngine components. It extends the FlexGrid control with these features:
Hierarchical row and column headers.
Collapsible row and column groups.
Drill-down into any cell to see the data used to compute its value.
Context menu for editing field properties.
To get started with the PivotGrid control, set the PivotGrid.itemsSource property to an instance of a PivotEngine in order to connect the two components.
First, you'll need a host element for the grid.
<div id="pivotGrid"></div>Then, you can create the PivotGrid in code.
let ng = new wjOlap.PivotEngine({
    autoGenerateFields: false,
    itemsSource: data
});

let pivotGrid = new wjOlap.PivotGrid("#pivotGrid", {
    itemsSource = ng
});
Subtotals
When connected to a PivotEngine configured to show row or column subtotals, the PivotGrid automatically creates collapsible groups of rows and columns.
You can configure the PivotEngine to show the subtotals before or after the data using the totalsBeforeData property:
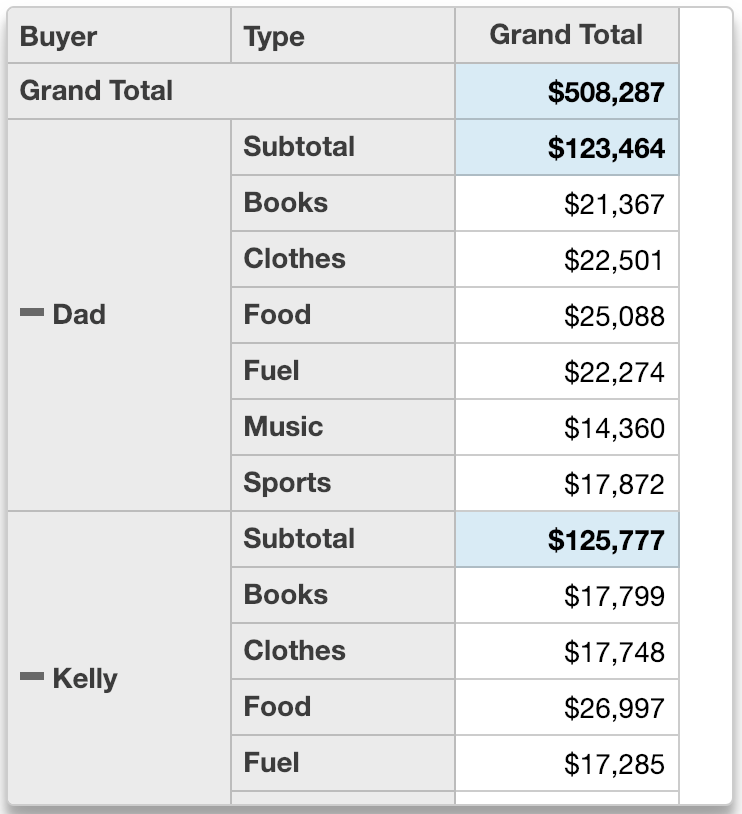
ng.totalsBeforeData = true;You can configure the PivotGrid to make row and column groups collapsible using the collapsibleSubtotals property.
pivotGrid.collapsibleSubtotals = true;With both of these enabled, you could get a grid that looks like this

Notice:
The 'Grand Totals' row is moved before data also.
SubTotals and Frozen Rows
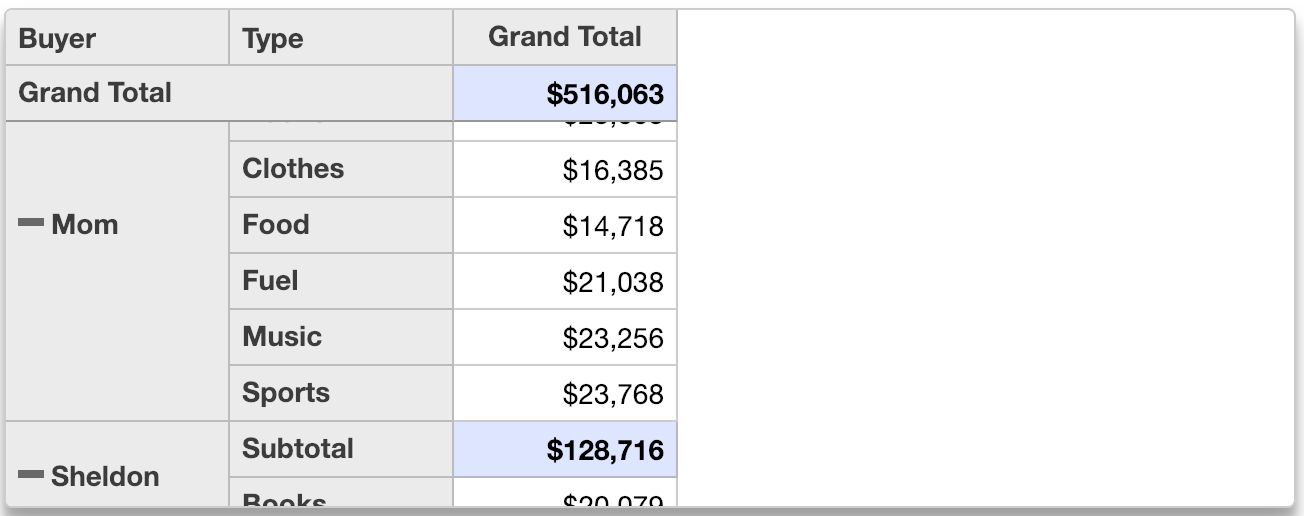
Configuring the PivotEngine to show totals above the data is convenient when the PivotGrid has frozen rows also. It ensures that the grand total remains visible when the grid scrolls.
This example keeps the Grand Total row fixed at the top of the grid as user scrolls.

You freeze rows in the PivotGrid in the same manner as a FlexGrid. Just set the frozenRows property equal to the number of rows you would like to freeze. The example below freezes the first row in the PivotGrid.
pivotGrid.frozenRows = 1;

