- SpreadJS Overview
- Getting Started
- JavaScript Frameworks
- Best Practices
- Features
- SpreadJS Designer
- SpreadJS Designer VSCode Plugin
- Tutorials
-
SpreadJS Designer Component
- Getting Started
- Quick Start
- Theme
- Designer Interface
- JavaScript Frameworks
- Template-Based Workbook Initialization
- Customizations
-
Work in Designer Component
- AutoSum Functions
- Set Range Template Cell
- Name Box
- Select Cells Using Go To
- Find and Replace
- Edit Font Size
- Edit Font Family
- Configure Cell Borders
- Manage Conditional Formatting Rules
- Shape Selection Pane
- Automatic Outline
- Format Painter
- Sort and Filter
- Table Slicer
- Data Source
- TableSheet
- GanttSheet Designer
- ReportSheet Designer
- Data Chart Designer
- Text to Columns
- Remove Duplicates
- Pivot Table
- Dockable Side Panel
- Command Palette
- Transform Cells with LAMBDA Formula
- Threaded Comments Panel
- What-If Analysis
- Insert Function Dialog
- Named Cell Templates
- Insert Pictures in Designer
- Toolbar Ribbon
- API Documentation
- SpreadJS Collaboration Server
- Touch Support
- Formula Reference
- Import and Export Reference
- Events
- API Documentation
- Release Notes
What-If Analysis
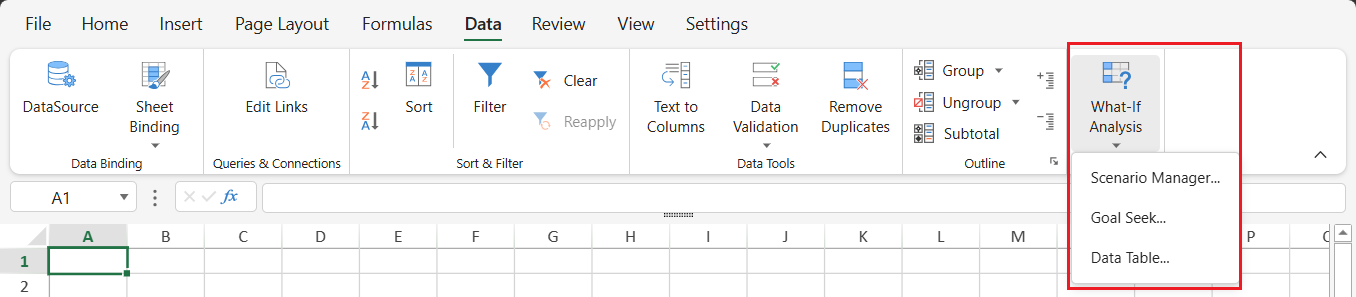
SpreadJS Designer supports for What‑If Analysis, including Scenario Manager, Goal Seek and Data Table.
These features are available from the Data tab in the ribbon.
Scenario Manager
Scenario Manager allows you to create, apply, restore, delete, merge, and summarize scenarios in SpreadJS Designer.
A scenario is a named set of input values for changing cells. Applying a scenario writes those values to the worksheet and recalculates dependent formulas.
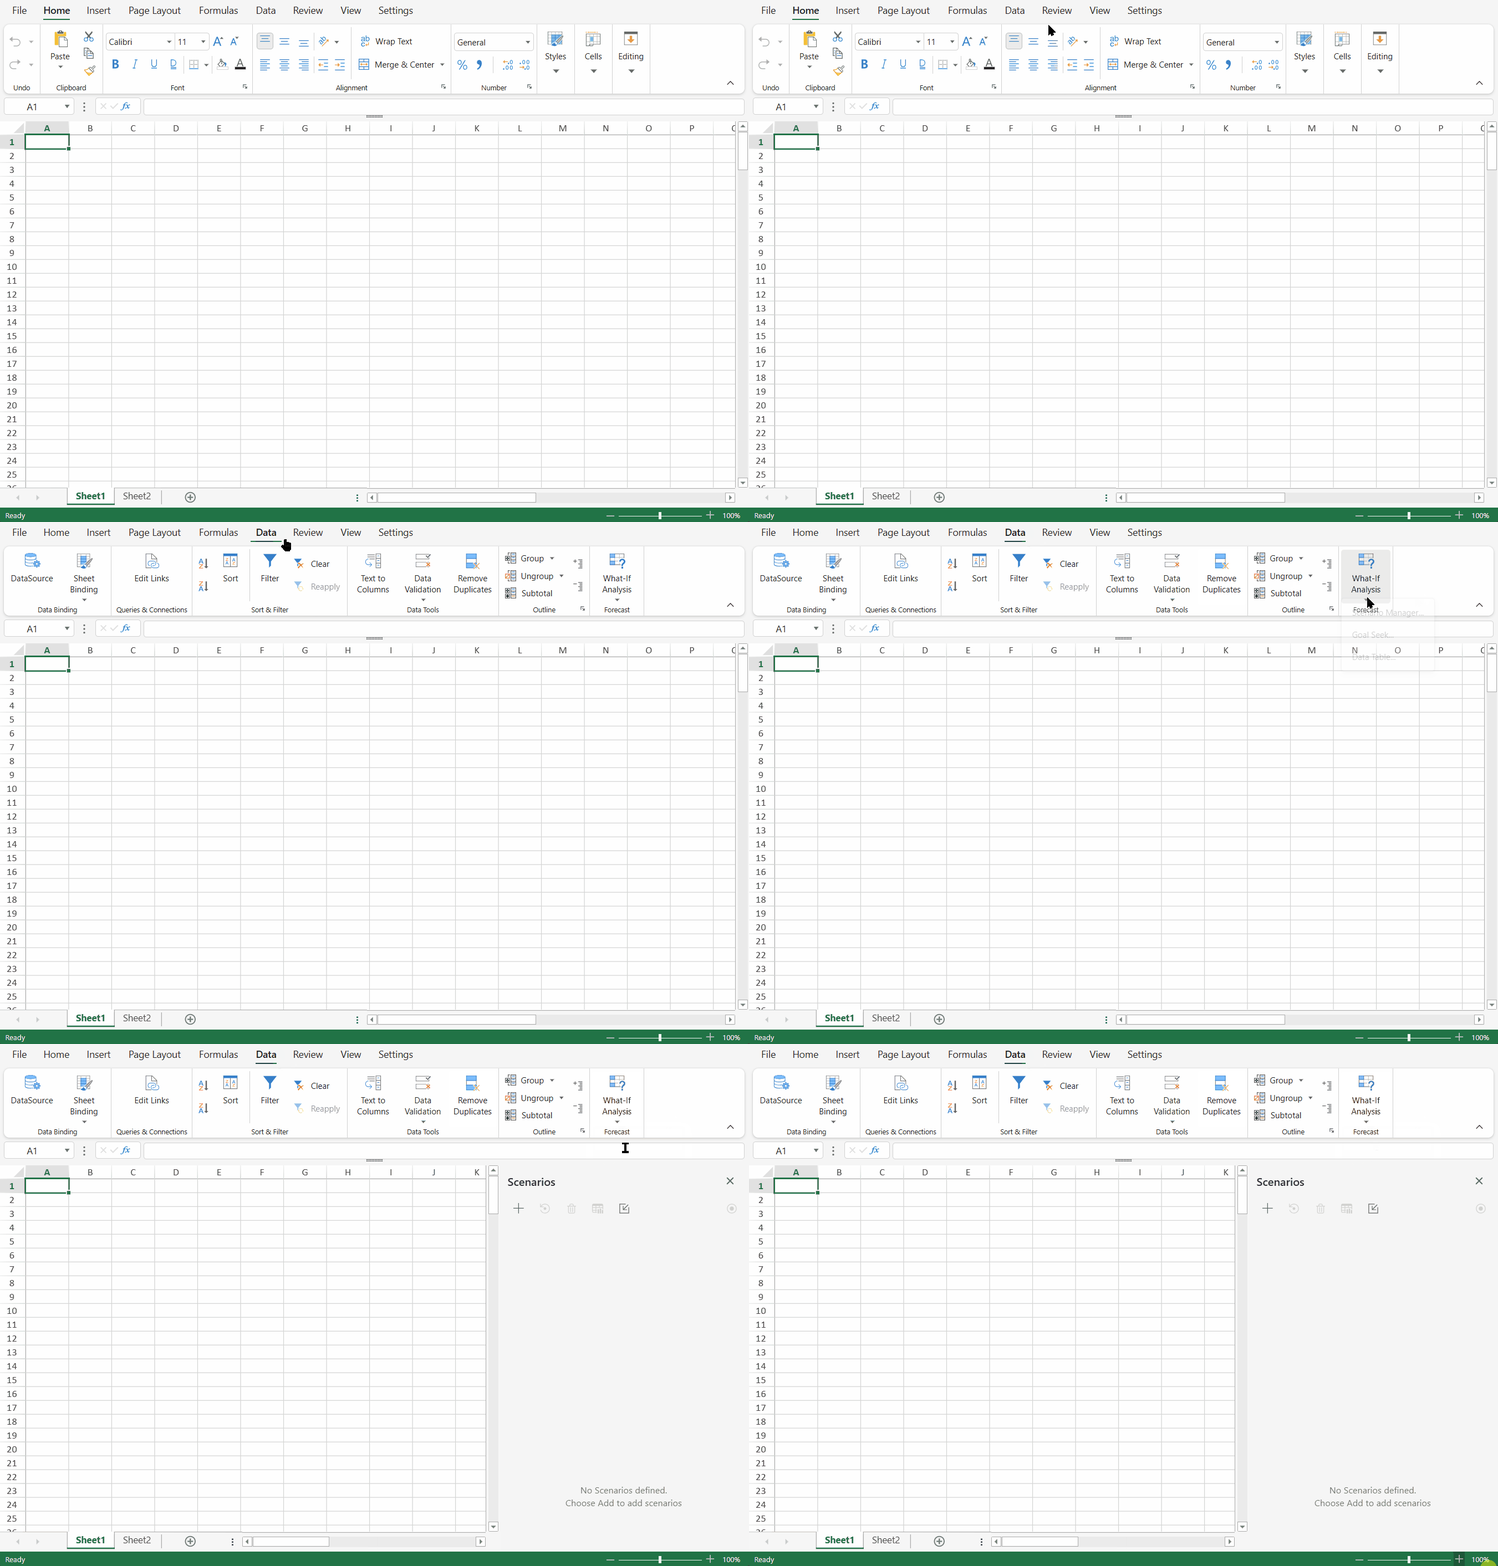
Open Scenario Manager
Go to Data → What‑If Analysis → Scenario Manager.
The Scenarios panel appears.
Manage Scenarios in the Scenario Panel
The Scenarios panel lists the scenarios in the workbook.
From the panel, you can:
Create a scenario.
Activate a scenario to record cell value edits.
Apply a scenario to the worksheet.
Restore an applied scenario.
Delete a scenario.
View the worksheets and changing cells included in a scenario.
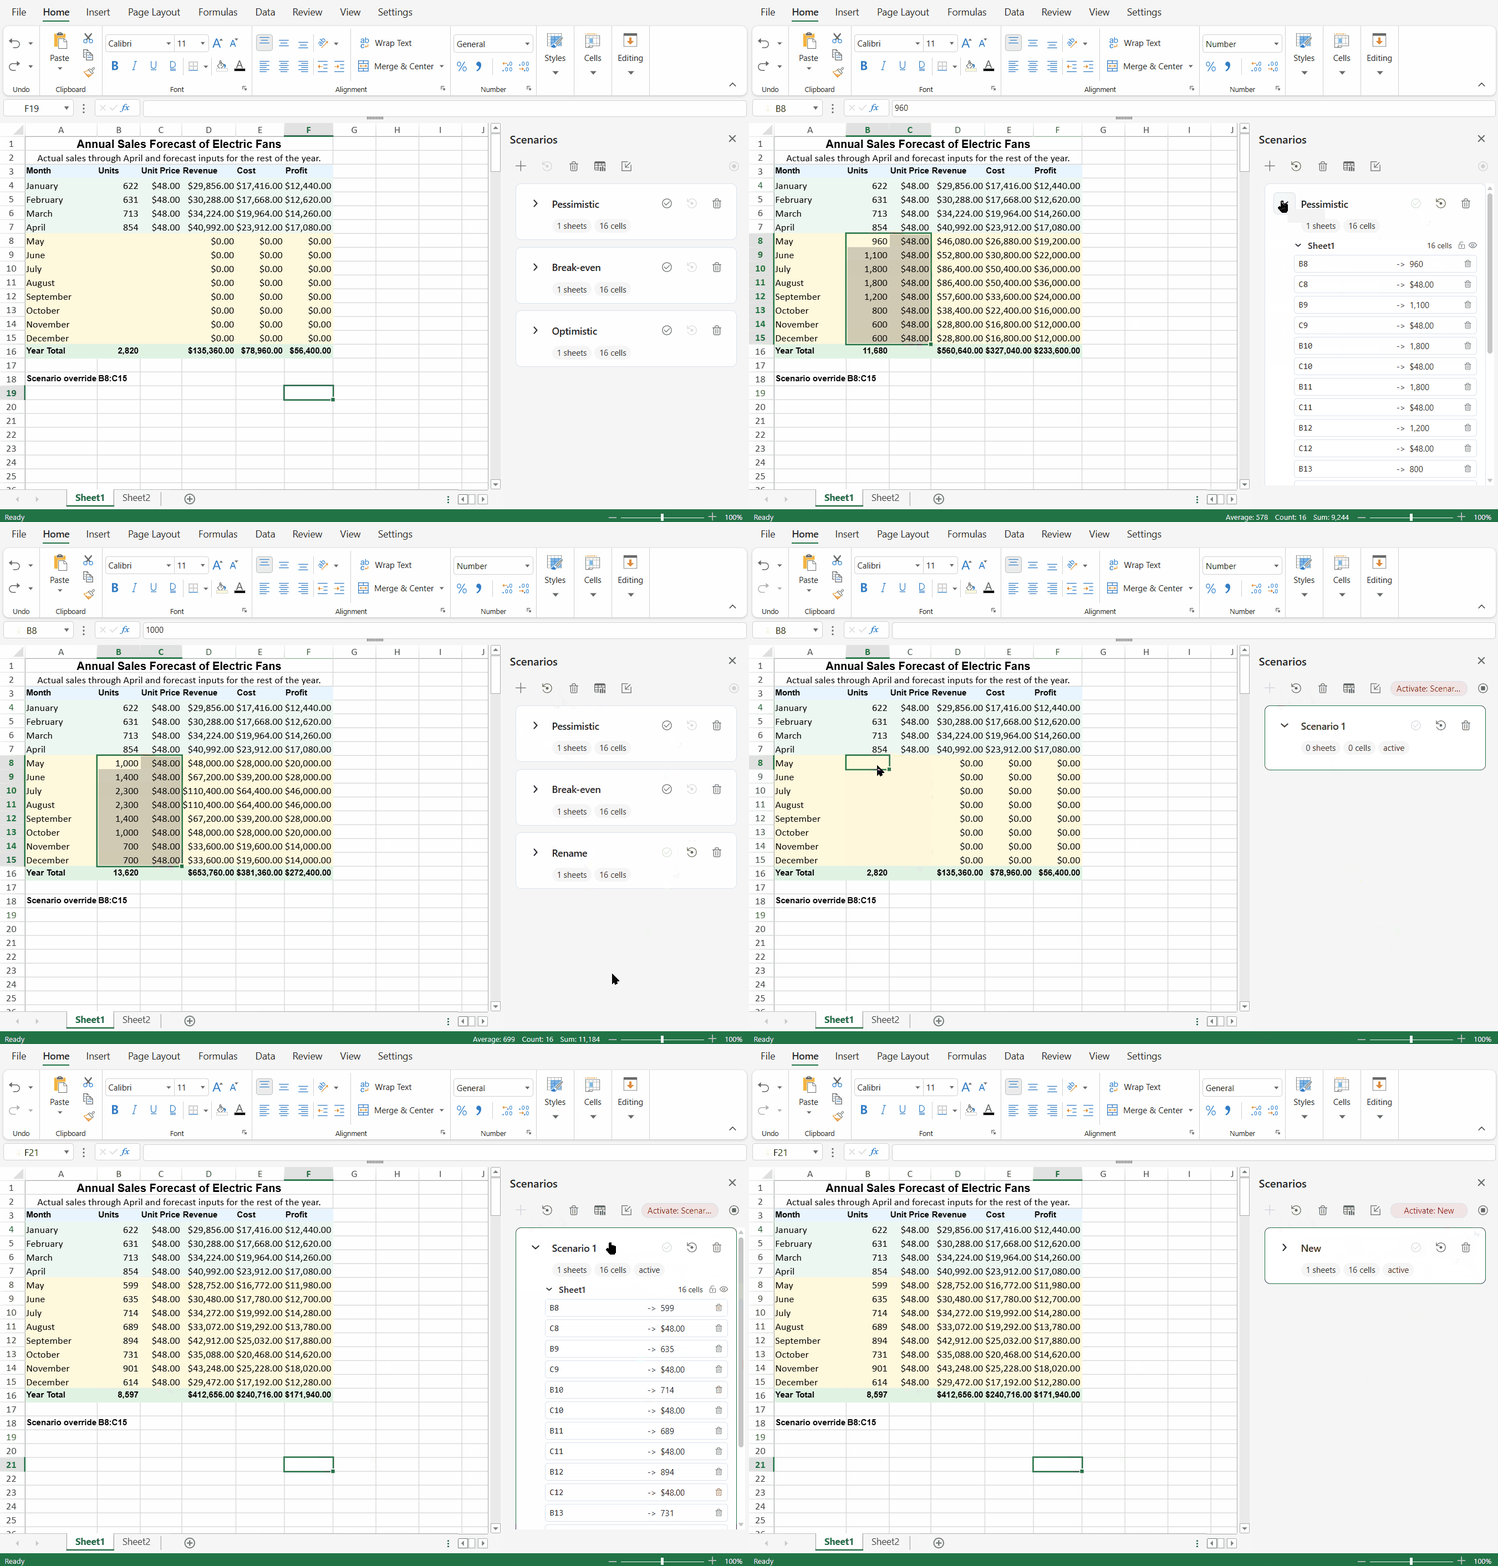
When a scenario is active, cell value edits are recorded into that scenario. Deactivating the scenario stops further recording but does not restore worksheet values.
Generate a Scenario Summary
Click Summary in the Scenario panel to open the Scenario Summary dialog.
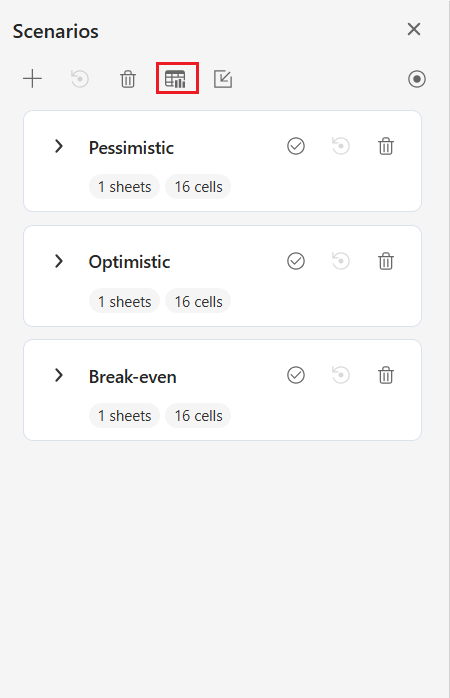
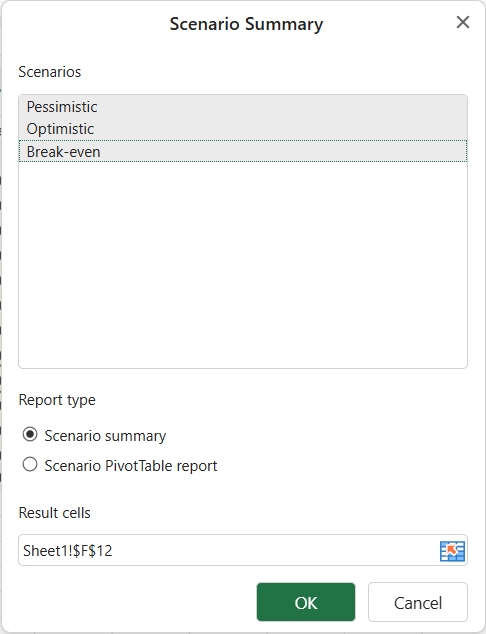
In the dialog, you can:
Select the scenarios to include in the report.
Select the report type.
Specify one or more result cells.
After you confirm the dialog, Designer generates a new worksheet containing the scenario summary report.
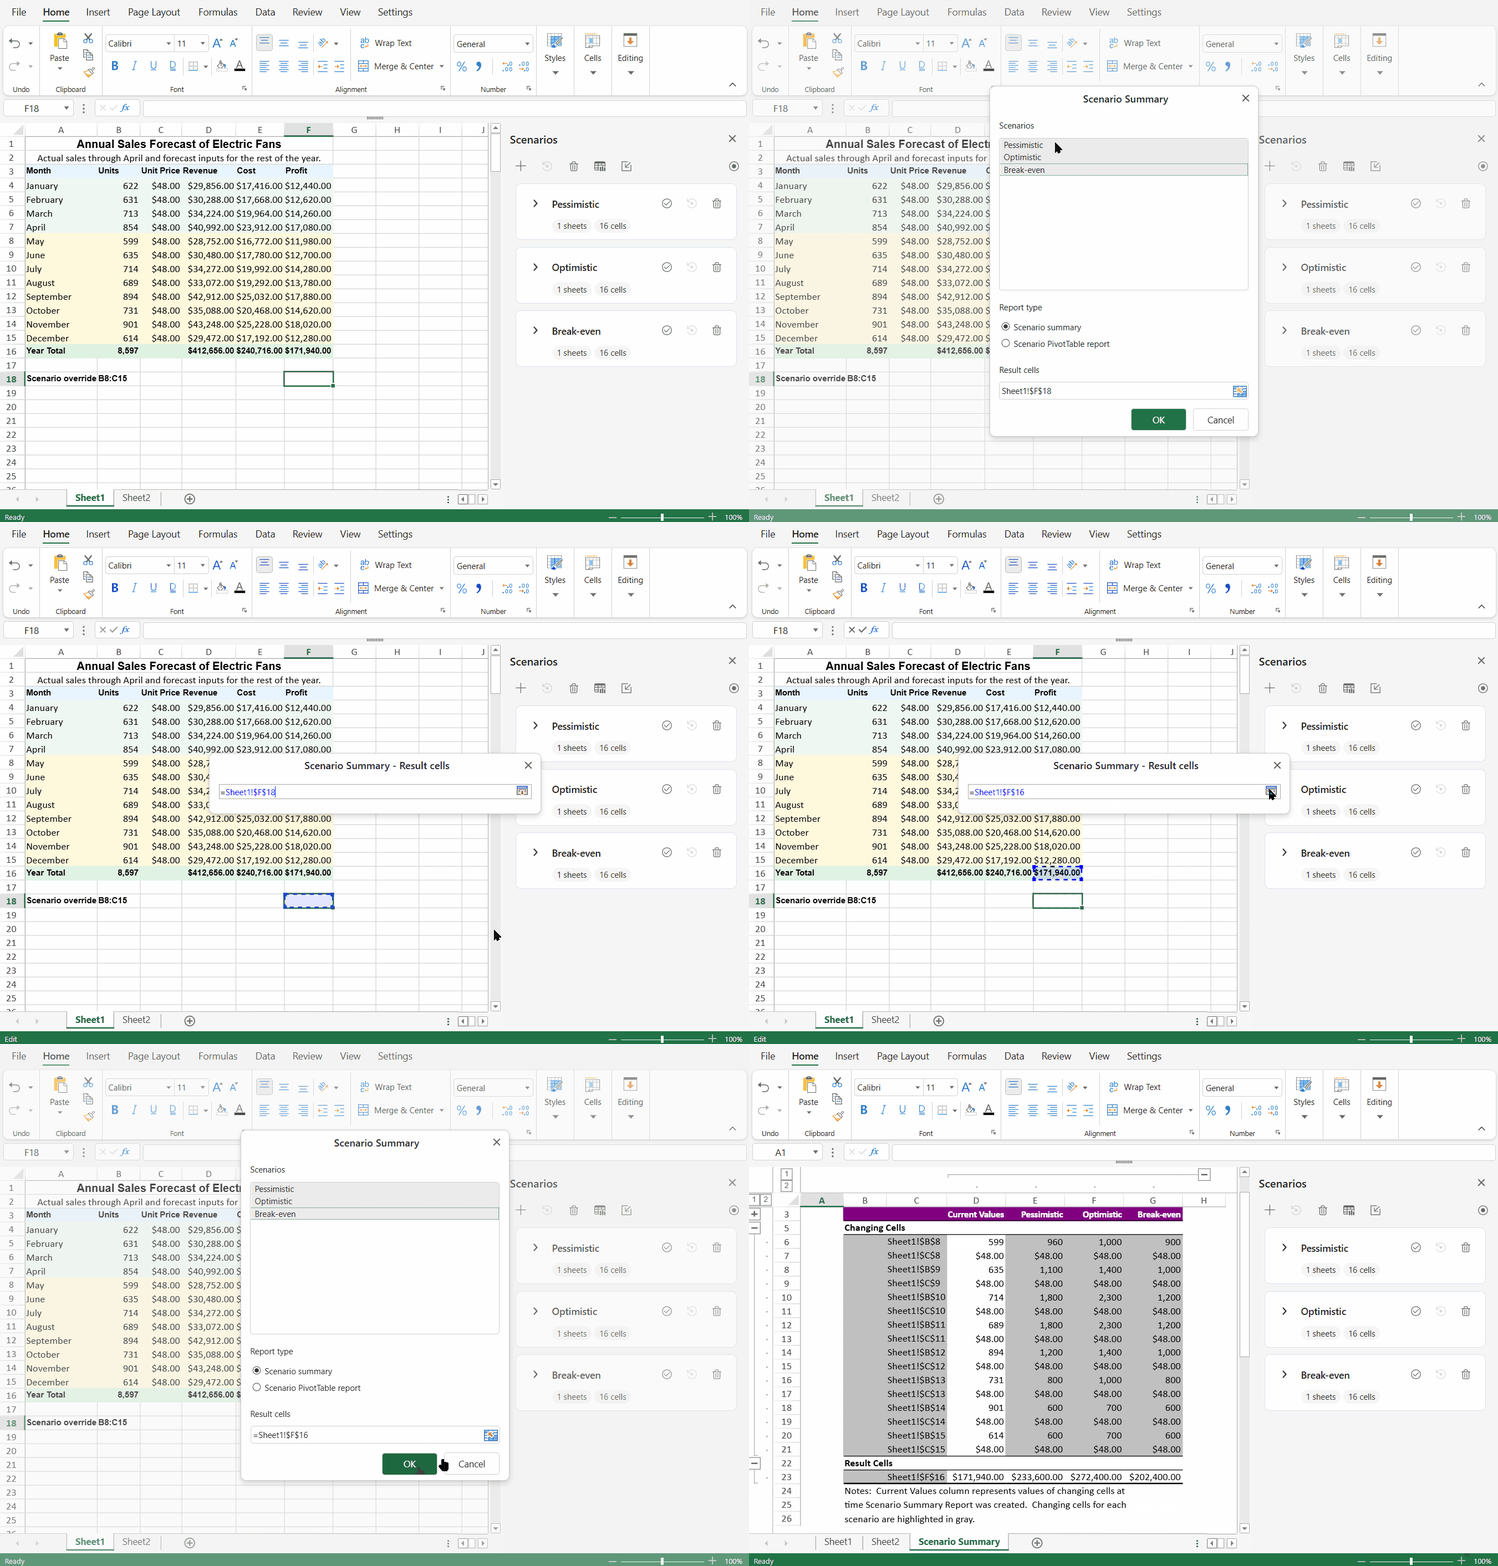
Sheet Summary
A Sheet Summary report lists the selected scenarios side by side.
The generated report includes:
A Current Values column.
One column for each selected scenario.
A Changing Cells section.
A Result Cells section when result cells are specified.
If defined names are available for changing cells or result cells, the report displays the defined names. Otherwise, it displays cell references.
Note:
The generated summary worksheet is a static snapshot and does not update automatically when scenarios or source cells change.
PivotTable Summary
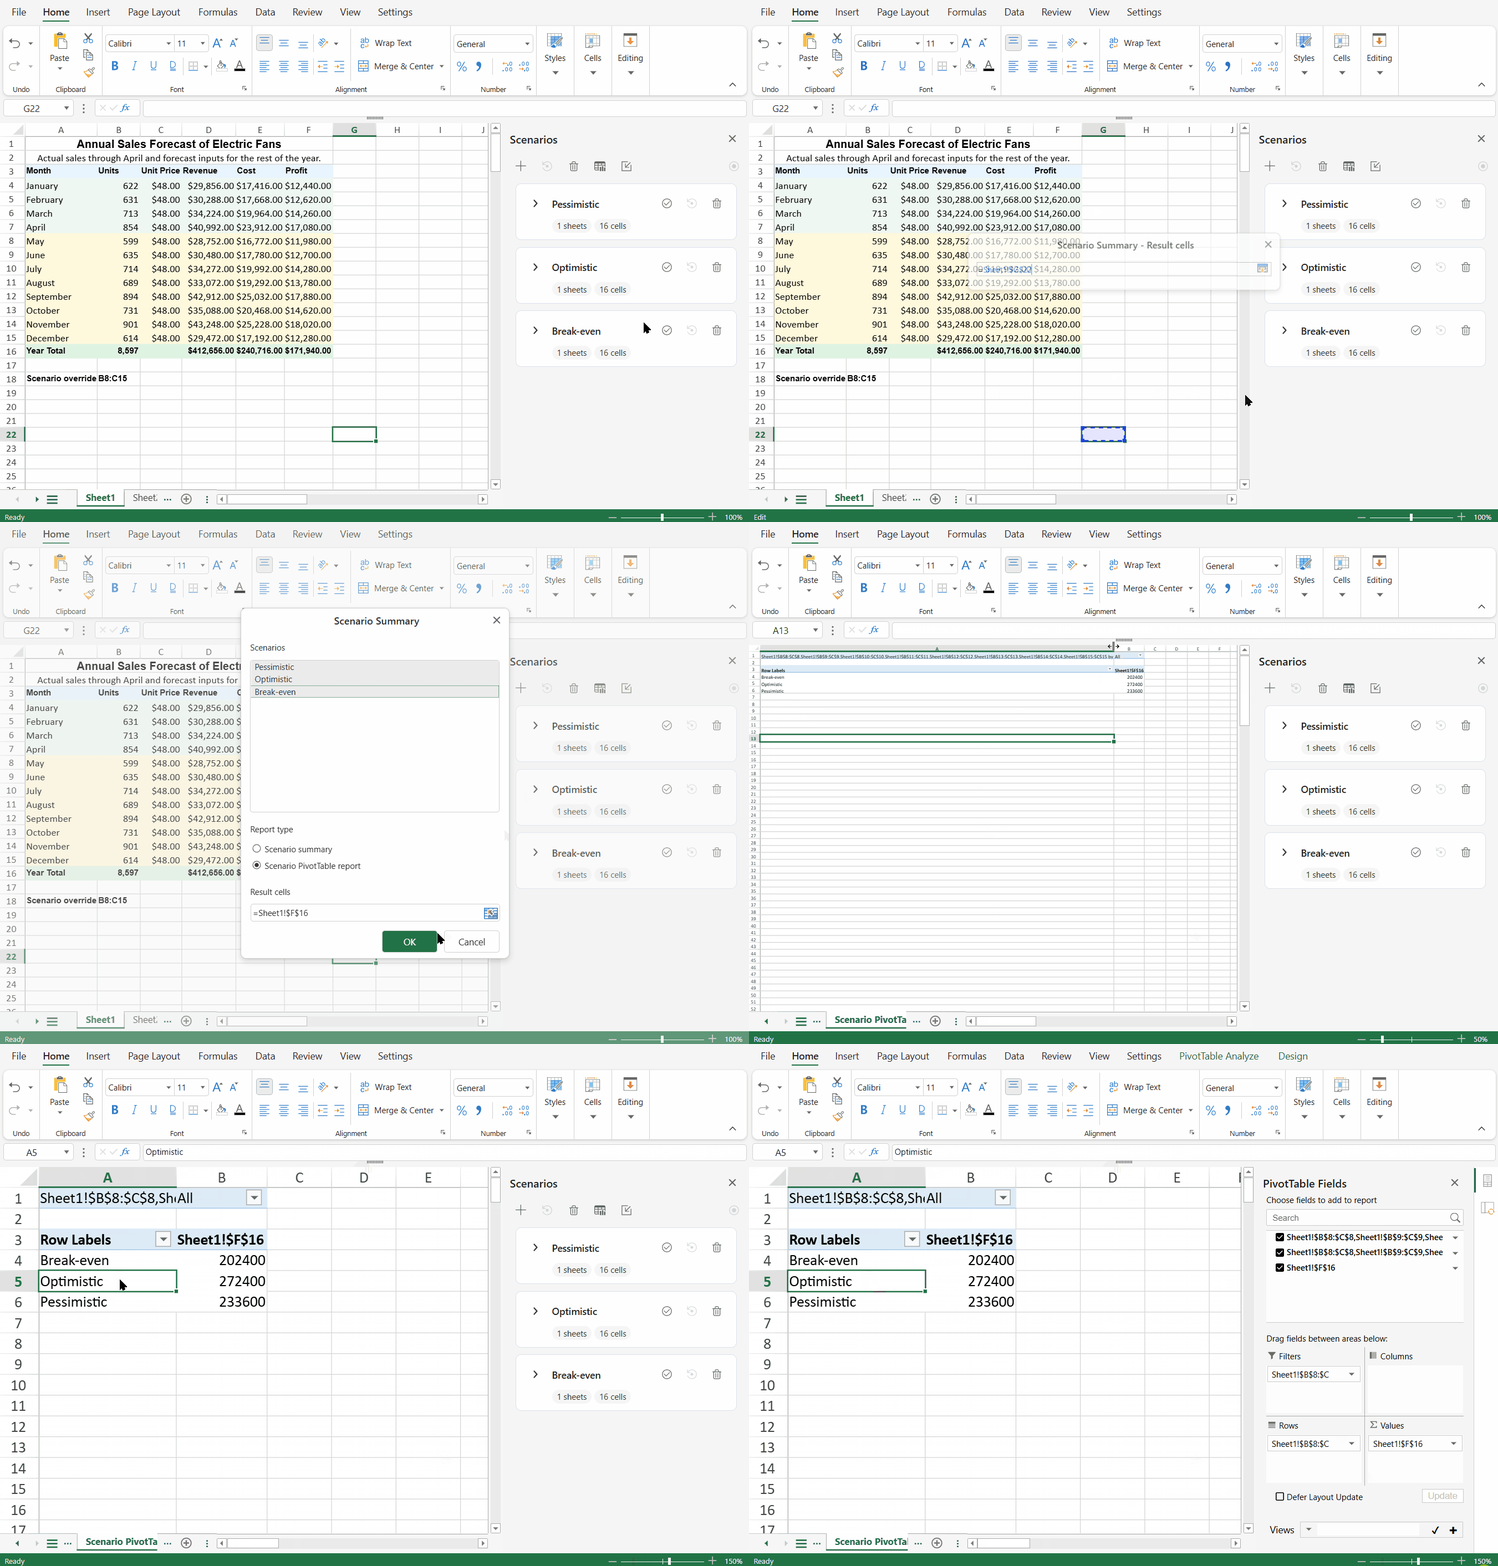
A PivotTable Summary report creates a PivotTable for comparing scenario result values.
Scenario names are displayed as row labels. Each selected result cell is displayed as a value field. When multiple result cells are selected, each result cell is displayed as a separate value column.
Notes:
A PivotTable Summary requires at least one result cell.
In Excel, a Scenario Summary PivotTable has limited persisted source data. After the workbook is saved, closed, and reopened, Excel may not support refreshing the data source or changing field settings for that PivotTable. When SpreadJS imports an Excel file that contains this type of PivotTable, the imported PivotTable Summary may not exactly match the display saved in Excel.
Merge Scenarios
Click Merge in the Scenario panel to import scenarios from another file.
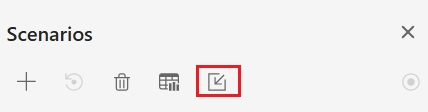
Designer supports importing scenarios from:
.sjs.ssjsonExcel files
After you select a source file, the Merge Scenarios dialog allows you to choose which scenarios to import.
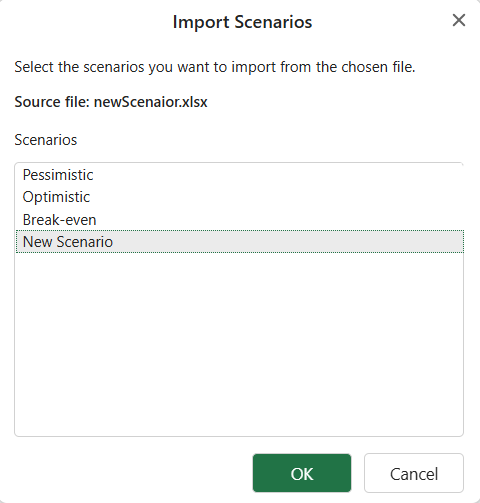
If an imported scenario name conflicts with an existing scenario name in the current workbook, Designer ignores the imported scenario.
Scenario Summary and Active Scenarios
Scenario summary reports are generated as report-only worksheets. If a scenario is active when the report is generated, changes made only to build the summary report are not recorded into the active scenario.
Lock and Hide Scenarios
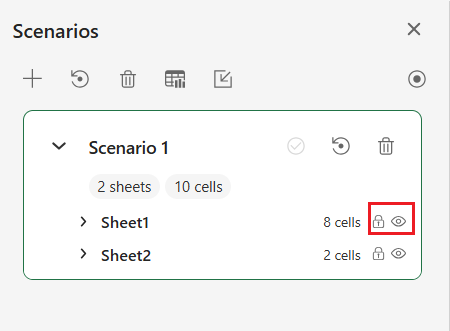
The lock  and visibility
  icons configure protection-related behavior for a worksheet-level scenario entry.
When the worksheet is protected and allowEditScenarios is not true, a locked entry is read-only and a hidden entry is not displayed in the Scenario Panel.
When allowEditScenarios is true, the entry remains editable and visible regardless of its locked and hidden settings.
Goal Seek
Goal Seek determines the input value required to achieve a specified formula result.
Open the Goal Seek Dialog
Go to Data → What‑If Analysis → Goal Seek.
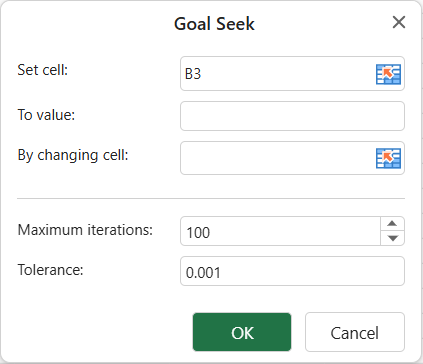
The Goal Seek dialog appears.
Configure Goal Seek
In the dialog, specify:
Set cell: The formula cell whose result you want to control.
To value: The desired result.
By changing cell: The input cell that will be adjusted.
Maximum iterations: The maximum number of calculation attempts.
Tolerance: The acceptable difference between the calculated result and the target value.
Click OK to start the process.
Goal Seek Execution
When Goal Seek starts:
The system iteratively updates the changing cell.
A Goal Seek Status pane displays the progress.
You can review intermediate results during calculation.
When the result falls within the specified tolerance:
A result dialog is displayed.
You can then choose:
OK – Apply the final value to the worksheet. The operation supports undo.
Cancel – Revert all changes made during the process.
Data Table
A Data Table evaluates a formula using multiple input values and returns the corresponding results.
Open the Data Table Dialog
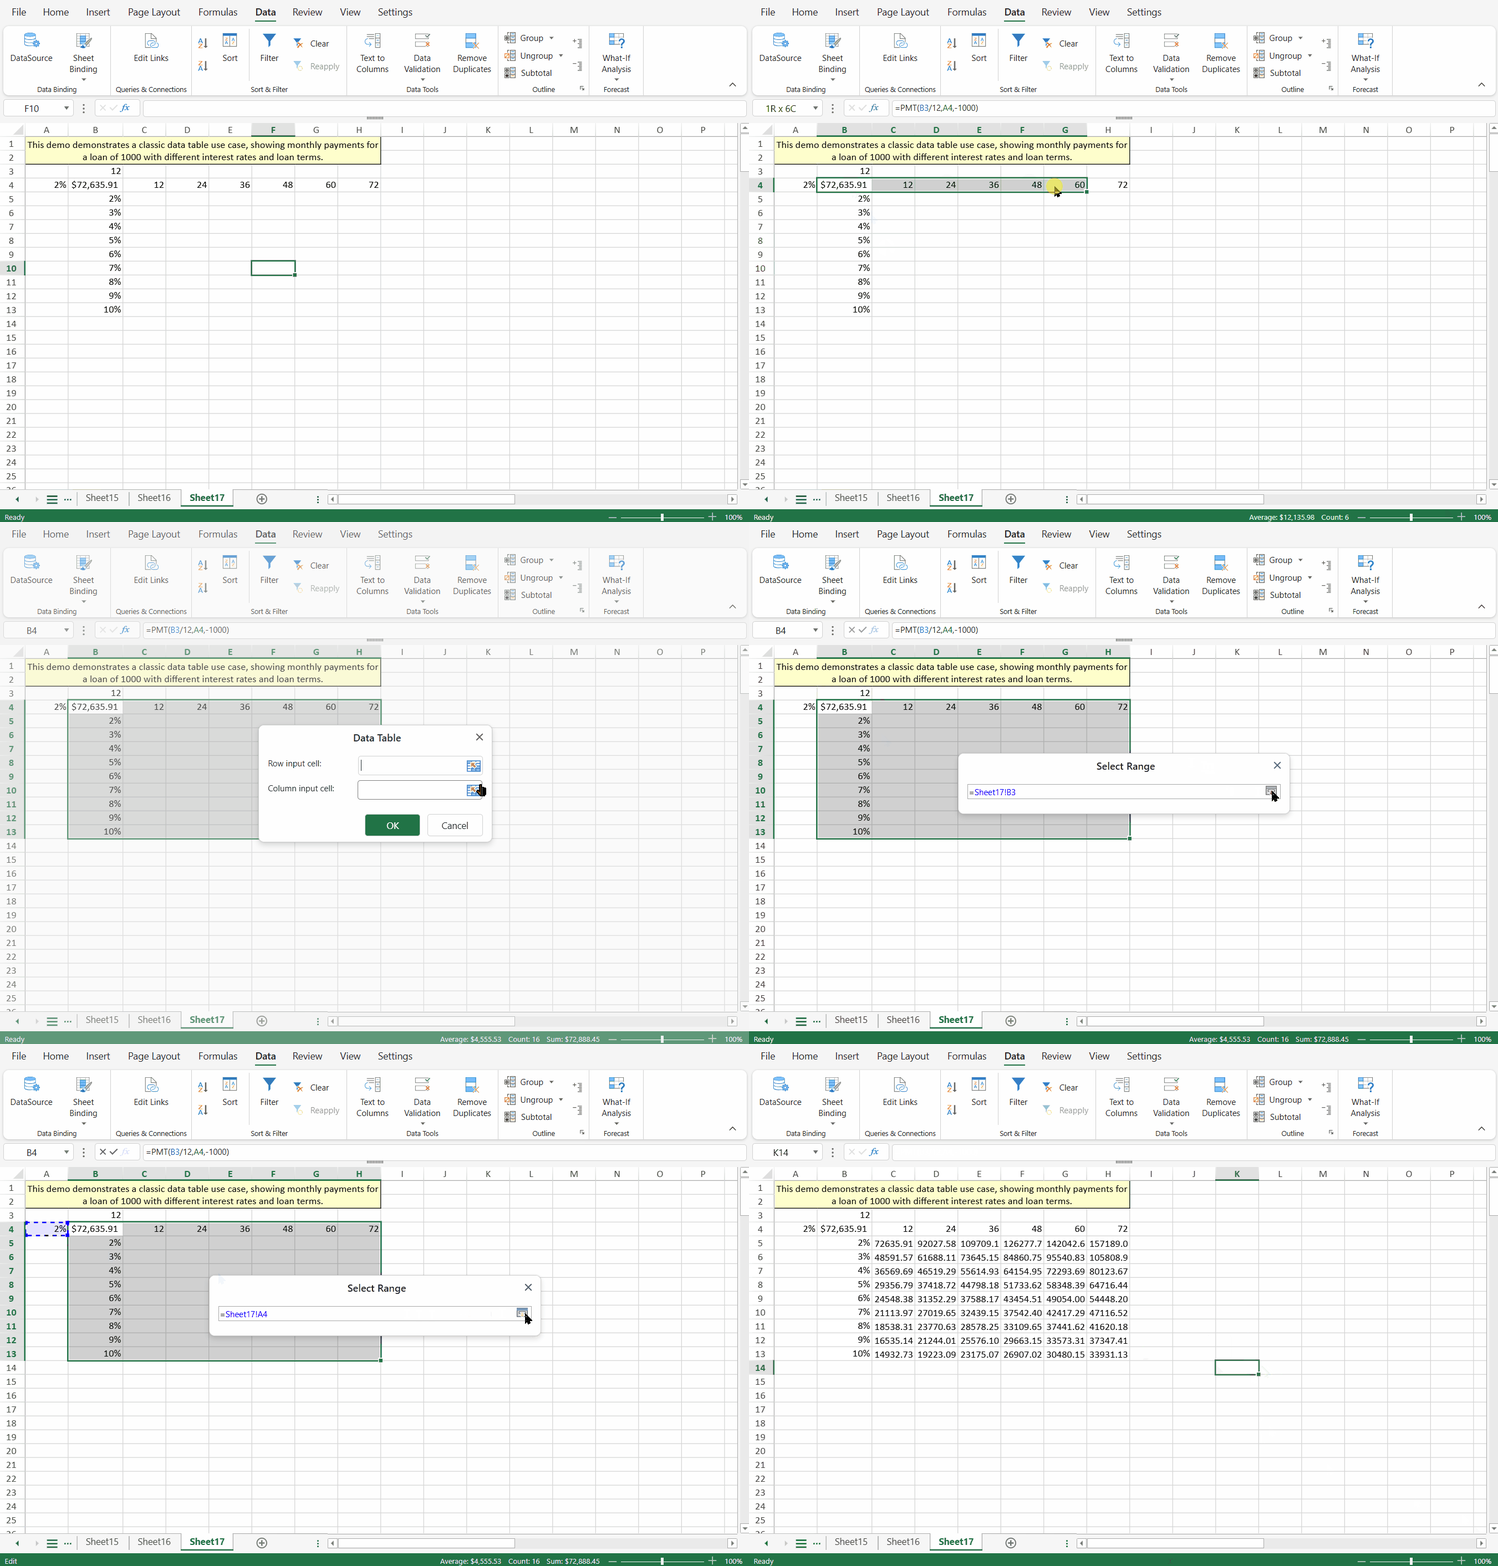
Select the target range in the worksheet.
Go to Data → What‑If Analysis → Data Table.
The Data Table dialog appears.
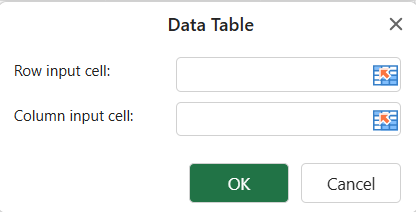
Configure the Data Table
In the dialog, specify:
Row input cell
Column input cell
At least one input cell must be provided.
Click OK to confirm.
After confirmation:
An
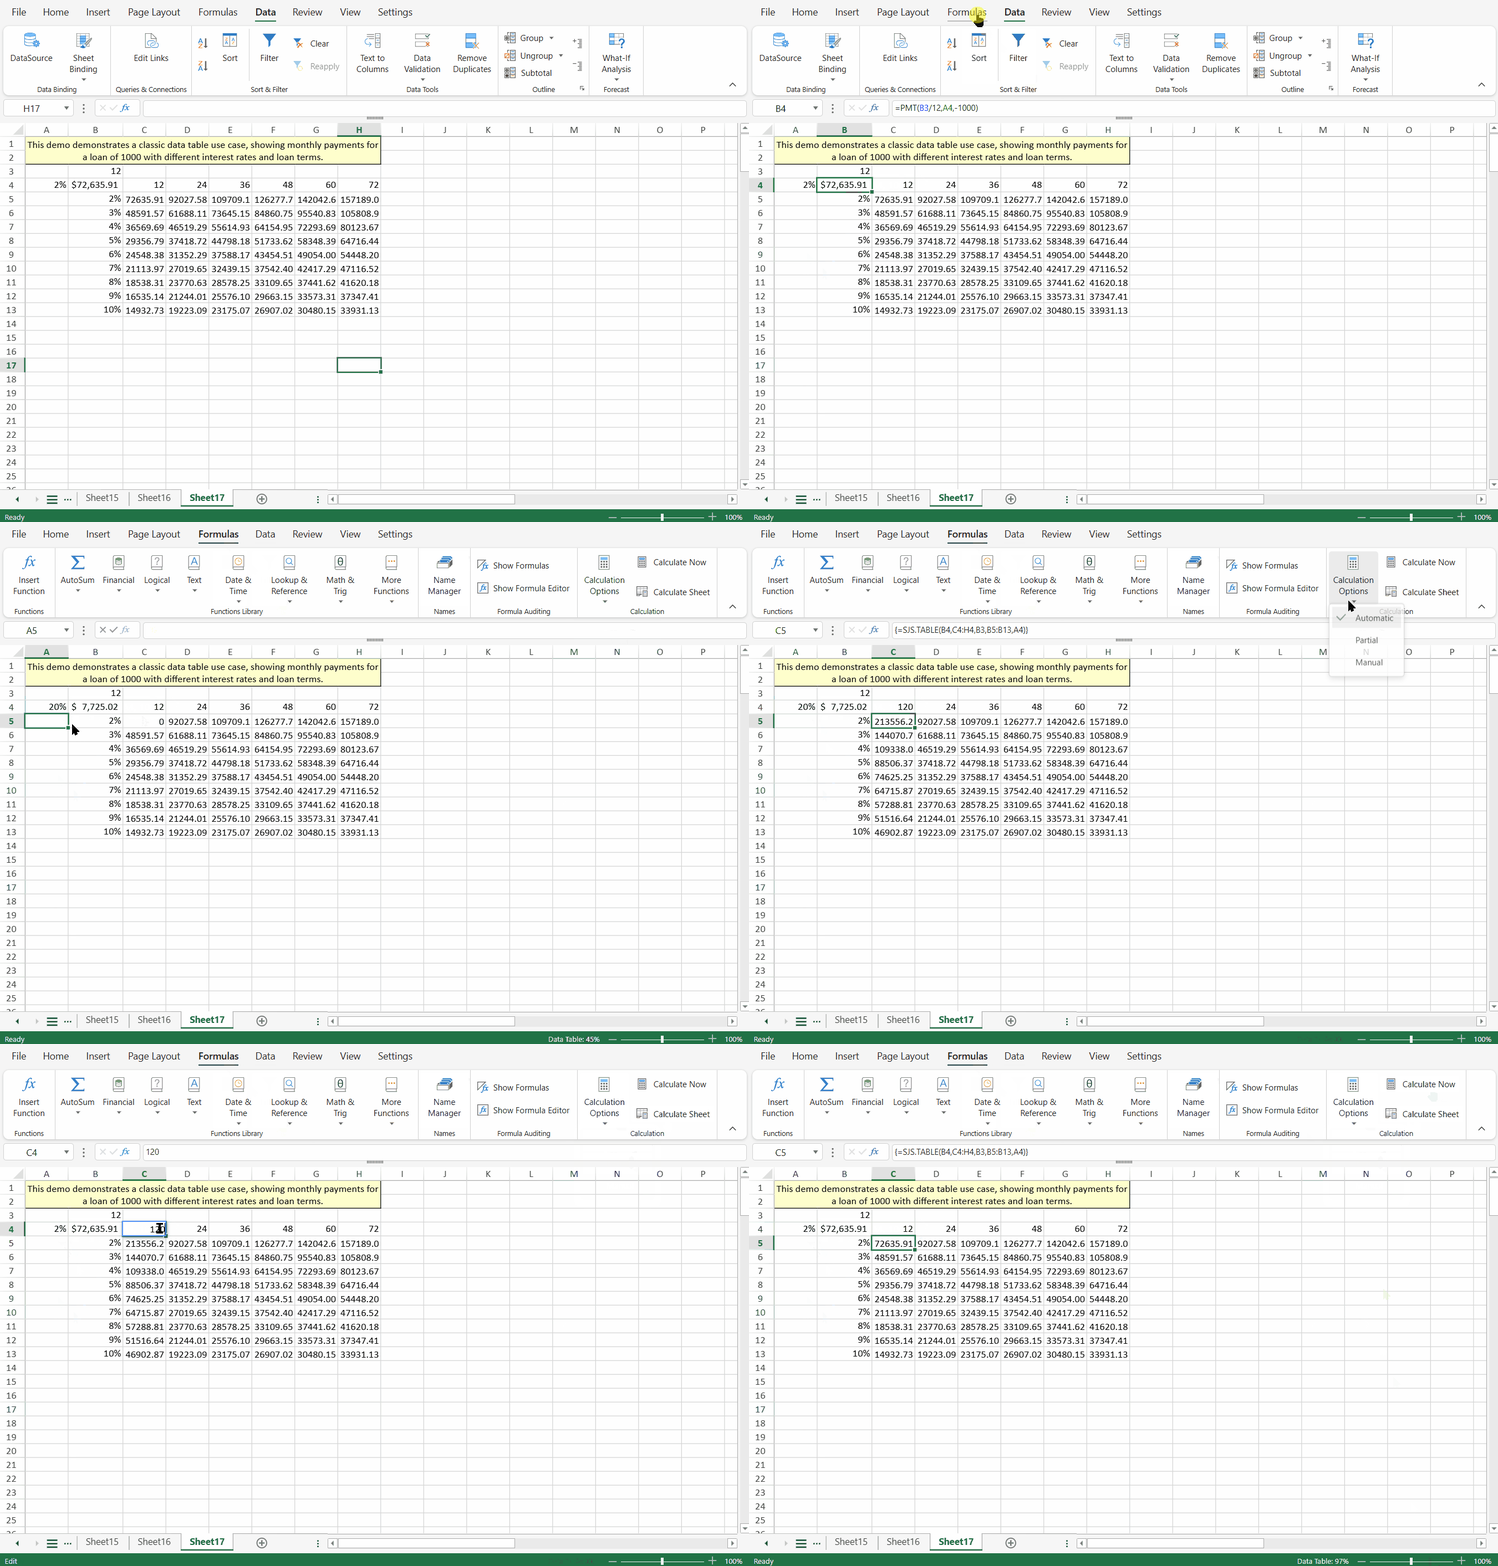
SJS.TABLEformula is inserted into the selected range.The results are calculated automatically.
Data Table Execution
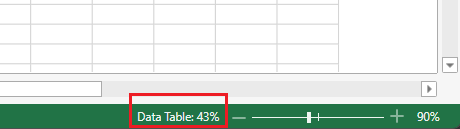
During calculation, the Status Bar displays the progress of the Data Table evaluation.
You can monitor the percentage completed until the calculation finishes.
Partial Calculation Mode
For performance optimization, Designer supports Partial Calculation mode for Data Table.
When enabled:
SJS.TABLEformulas are not recalculated automatically when dependent values change.Users must manually trigger recalculation by clicking the Calculate button.
This mode is recommended when working with large data tables.