


- SpreadJS Overview
- Getting Started
- JavaScript Frameworks
- Best Practices
- Features
- SpreadJS Designer
- SpreadJS Designer VSCode Plugin
- Tutorials
-
SpreadJS Designer Component
- Getting Started
- Quick Start
- Theme
- Designer Interface
- JavaScript Frameworks
- Template-Based Workbook Initialization
- Customizations
-
Work in Designer Component
- AutoSum Functions
- Set Range Template Cell
- Name Box
- Select Cells Using Go To
- Find and Replace
- Edit Font Size
- Edit Font Family
- Configure Cell Borders
- Manage Conditional Formatting Rules
- Shape Selection Pane
- Automatic Outline
- Format Painter
- Sort and Filter
- Table Slicer
- Data Source
- TableSheet
- GanttSheet Designer
- ReportSheet Designer
- Data Chart Designer
- Text to Columns
- Remove Duplicates
- Pivot Table
- Dockable Side Panel
- Command Palette
- Transform Cells with LAMBDA Formula
- Threaded Comments Panel
- What-If Analysis
- Insert Function Dialog
- Named Cell Templates
- Insert Pictures in Designer
- Toolbar Ribbon
- API Documentation
- SpreadJS Collaboration Server
- Touch Support
- Formula Reference
- Import and Export Reference
- Events
- API Documentation
- Release Notes
TableSheet
SpreadJS Designer provides the ability to add a TableSheet in a workbook.
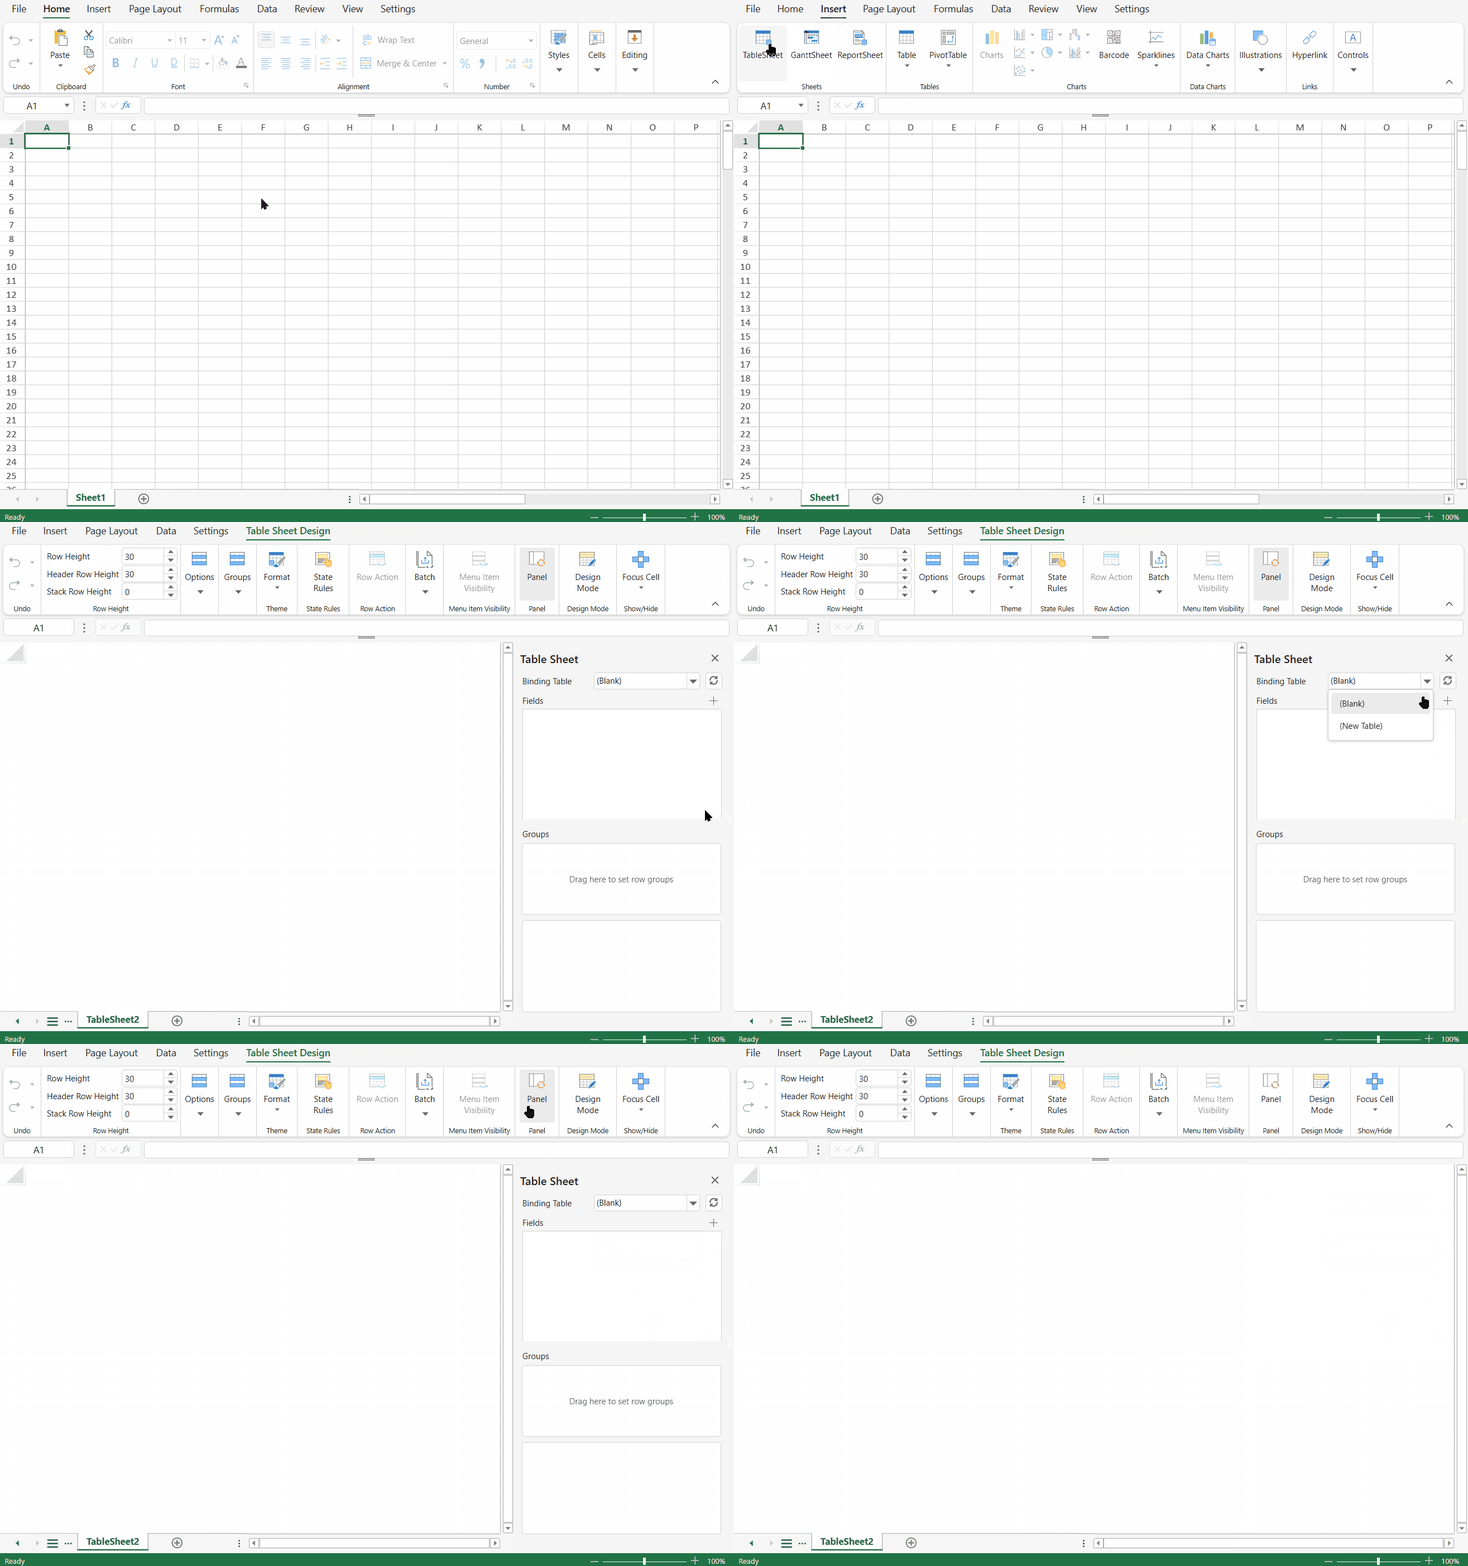
The TableSheet ribbon button can be found in the INSERT > Sheets tab group. Clicking on the ribbon button adds a TableSheet1 tab in the open workbook and activates the TABLE SHEET DESIGN tab.
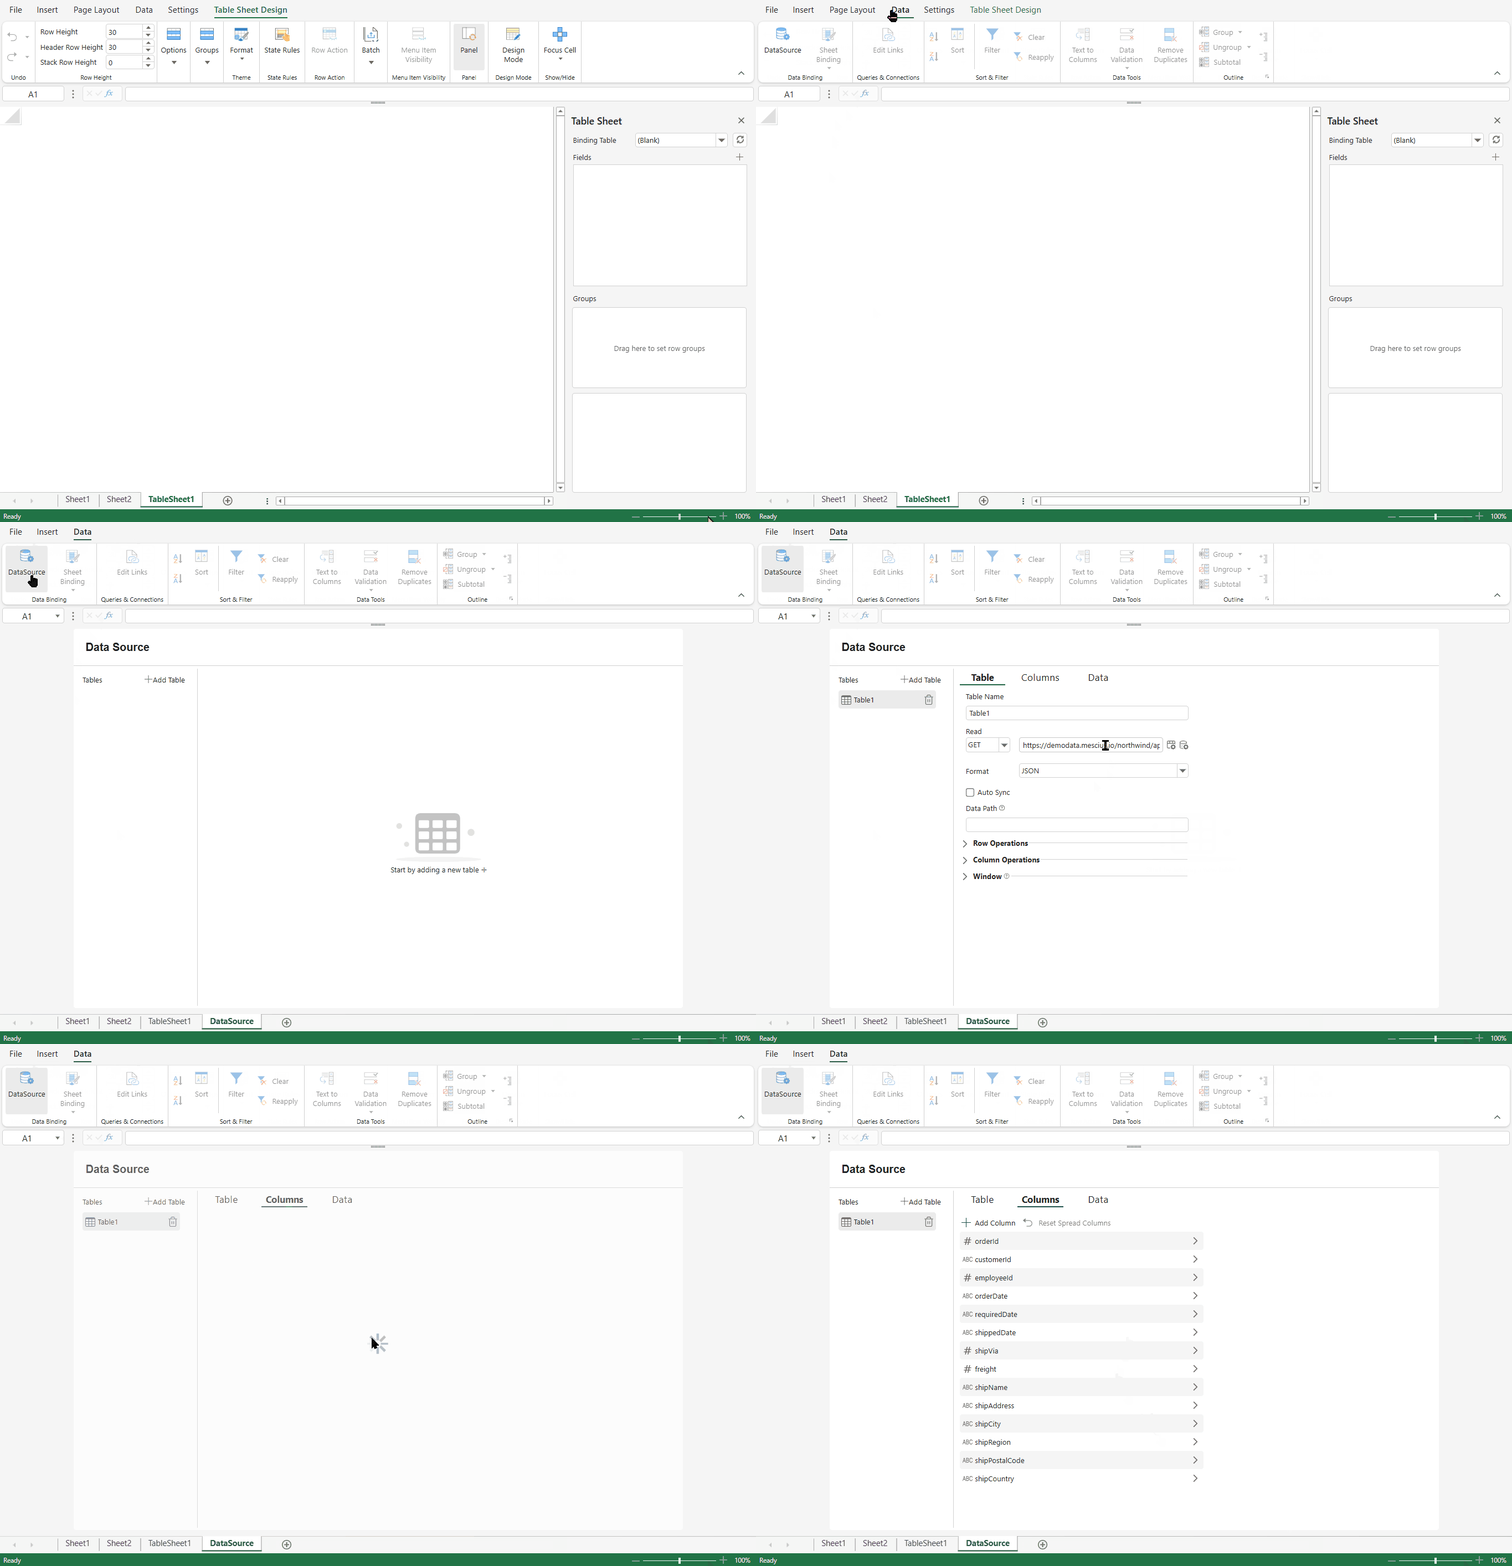
You can create a data source by clicking the DataSource ribbon button in the DATA > Data Binding tab group. The DataSource tab appears where you can add a table and set the remote URL for CRUD (create, read, update, and delete) capabilities. You can fetch the table data through the Columns tab as well.
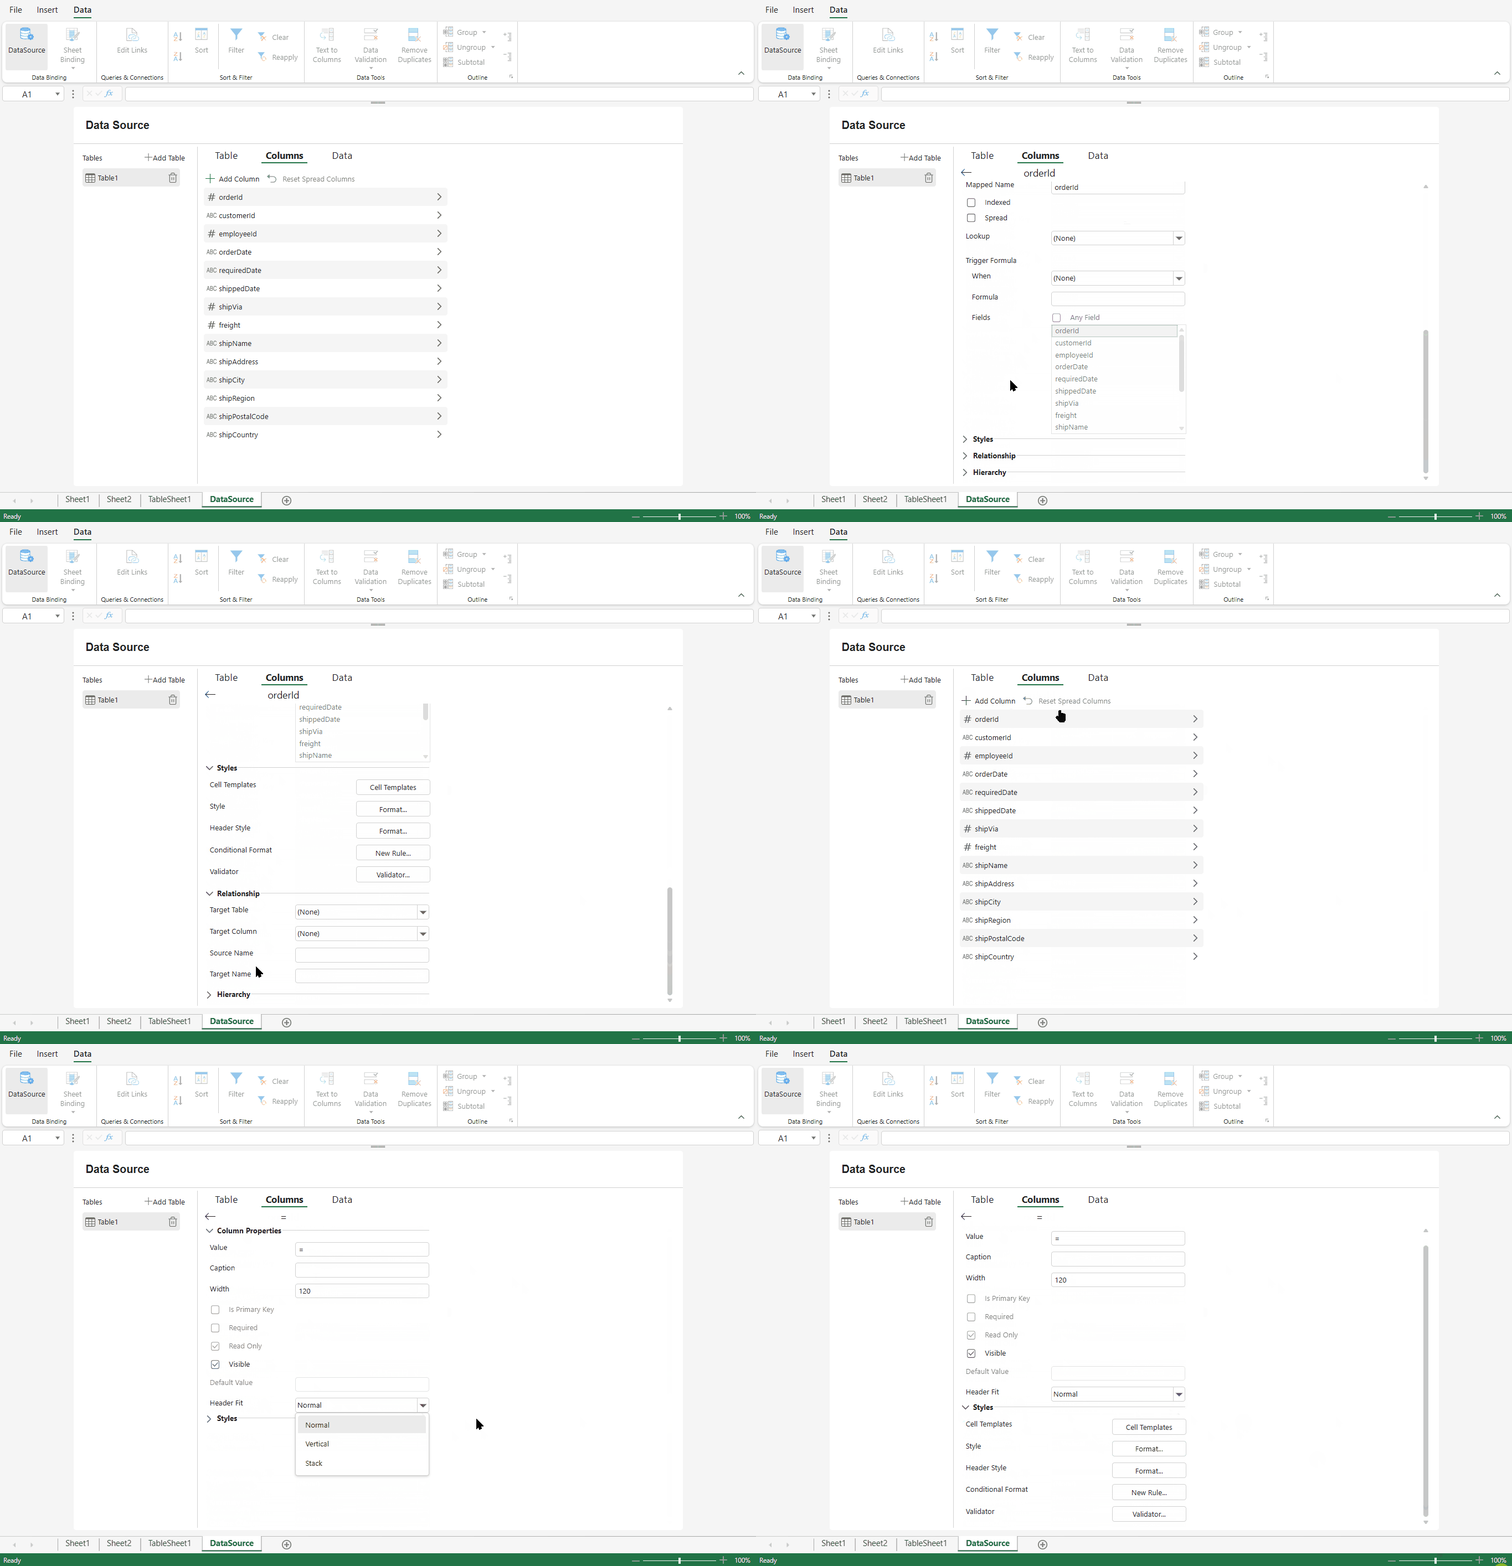
You can click a column item to show or edit a column item by setting its properties, and schema type, or to add a relationship. A calculated column can also be added by clicking the + Add Column at the top of the list.
After adding the Data Source in Designer, users can now bind the table data source into TableSheet through the Designer Table Sheet Panel. Select the existing table data source or create a new table data source through the Binding Table dropdown. The TableSheet view will load up on the previously empty area.
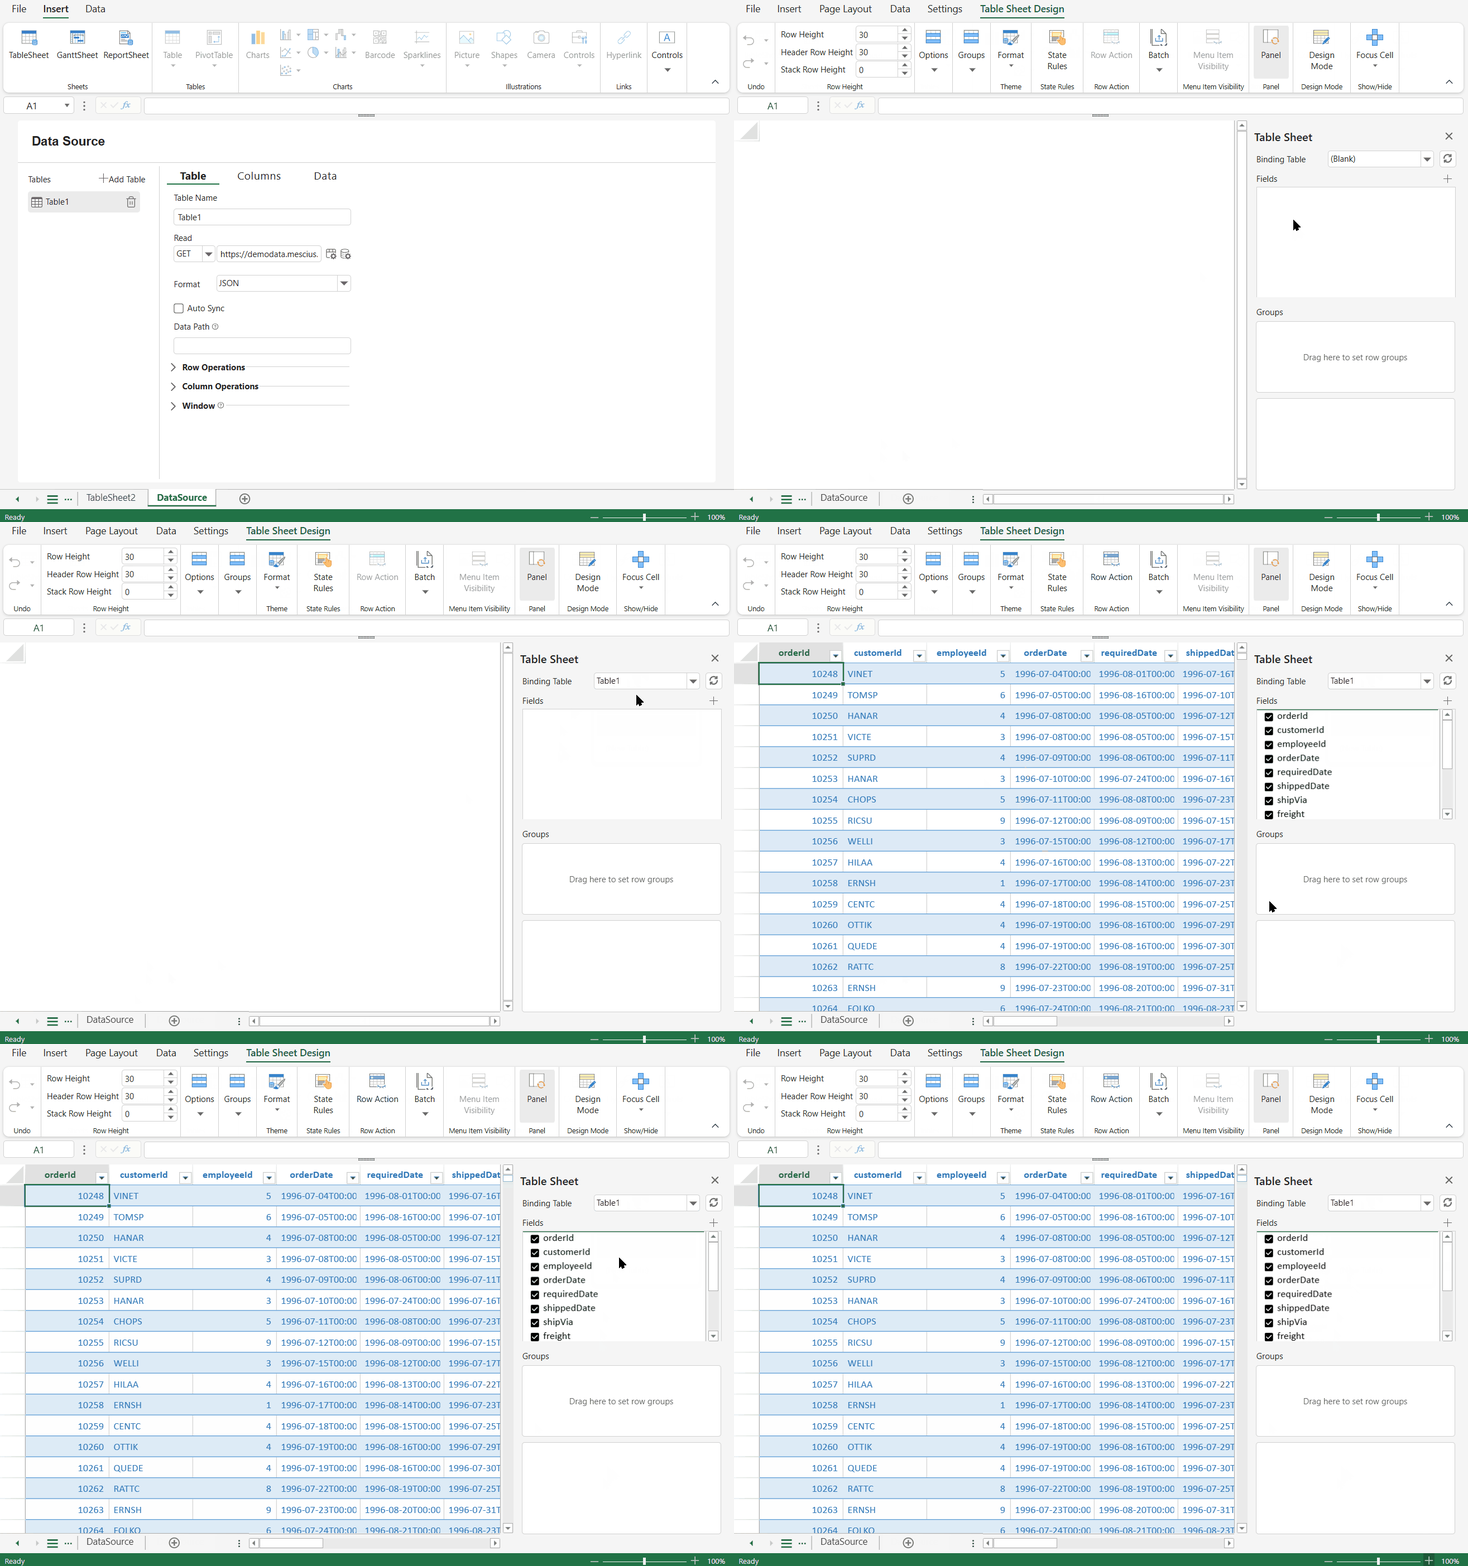
The TableSheet field area and group area work the same as their runtime counterpart. To know more, refer to TableSheet Components.
Note: The DataSource sheet does not export to SSJSON or Excel files, but the DataSource tables with table options are included in SSJSON.
Display Relationship in DataSource Column
SpreadJS allows you to showcase relationships as a column in the Data Source Columns list both for the designer and the runtime table sheet panel.
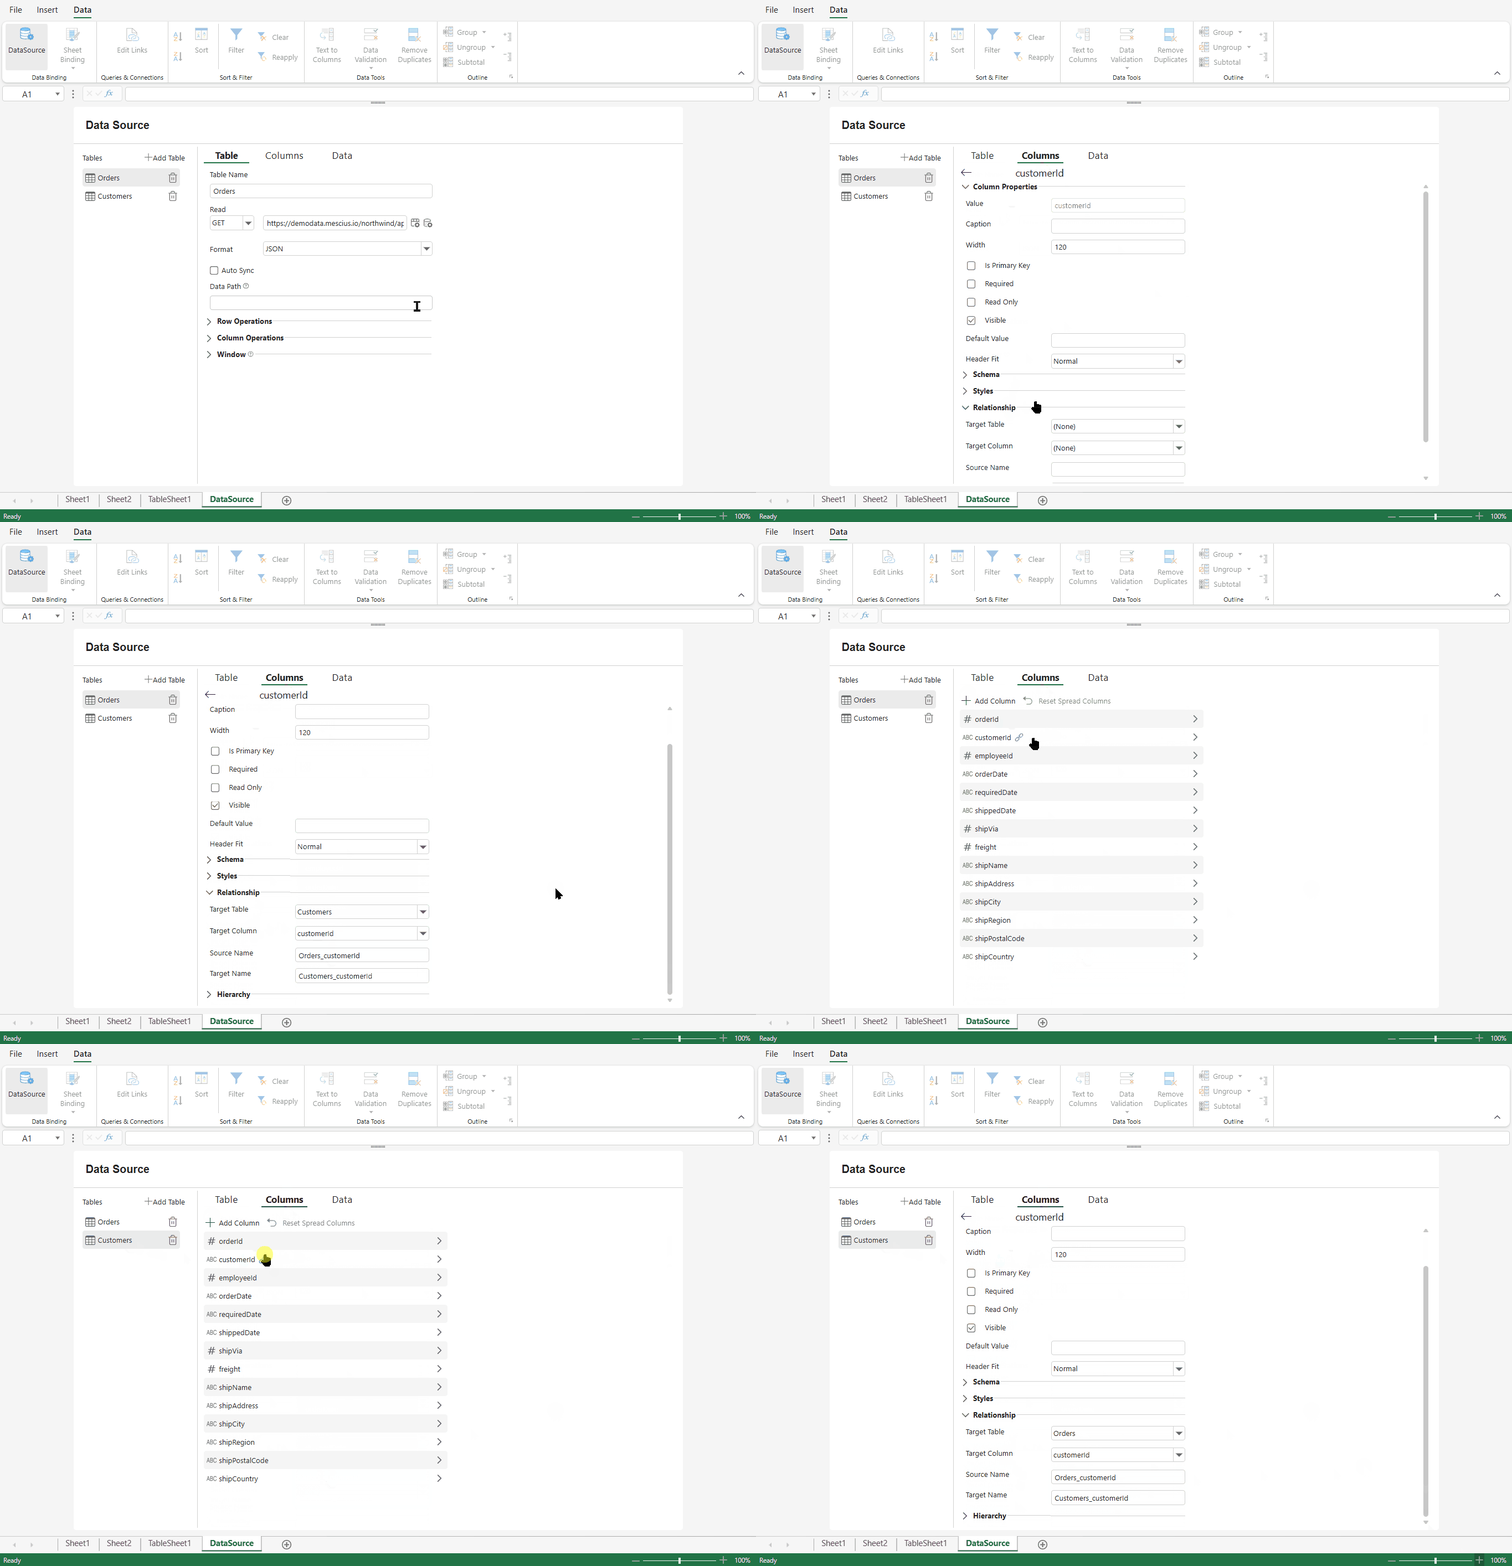
Display Relationship in Designer Panel
SpreadJS also displays relationships in the Table Sheet Designer side panel. To make the UI more space-saving, the side panel only shows the name of the relationship column with an expand or collapse button. Hence, it is convenient to expand or collapse the relationship column nodes and view the child nodes, when required.
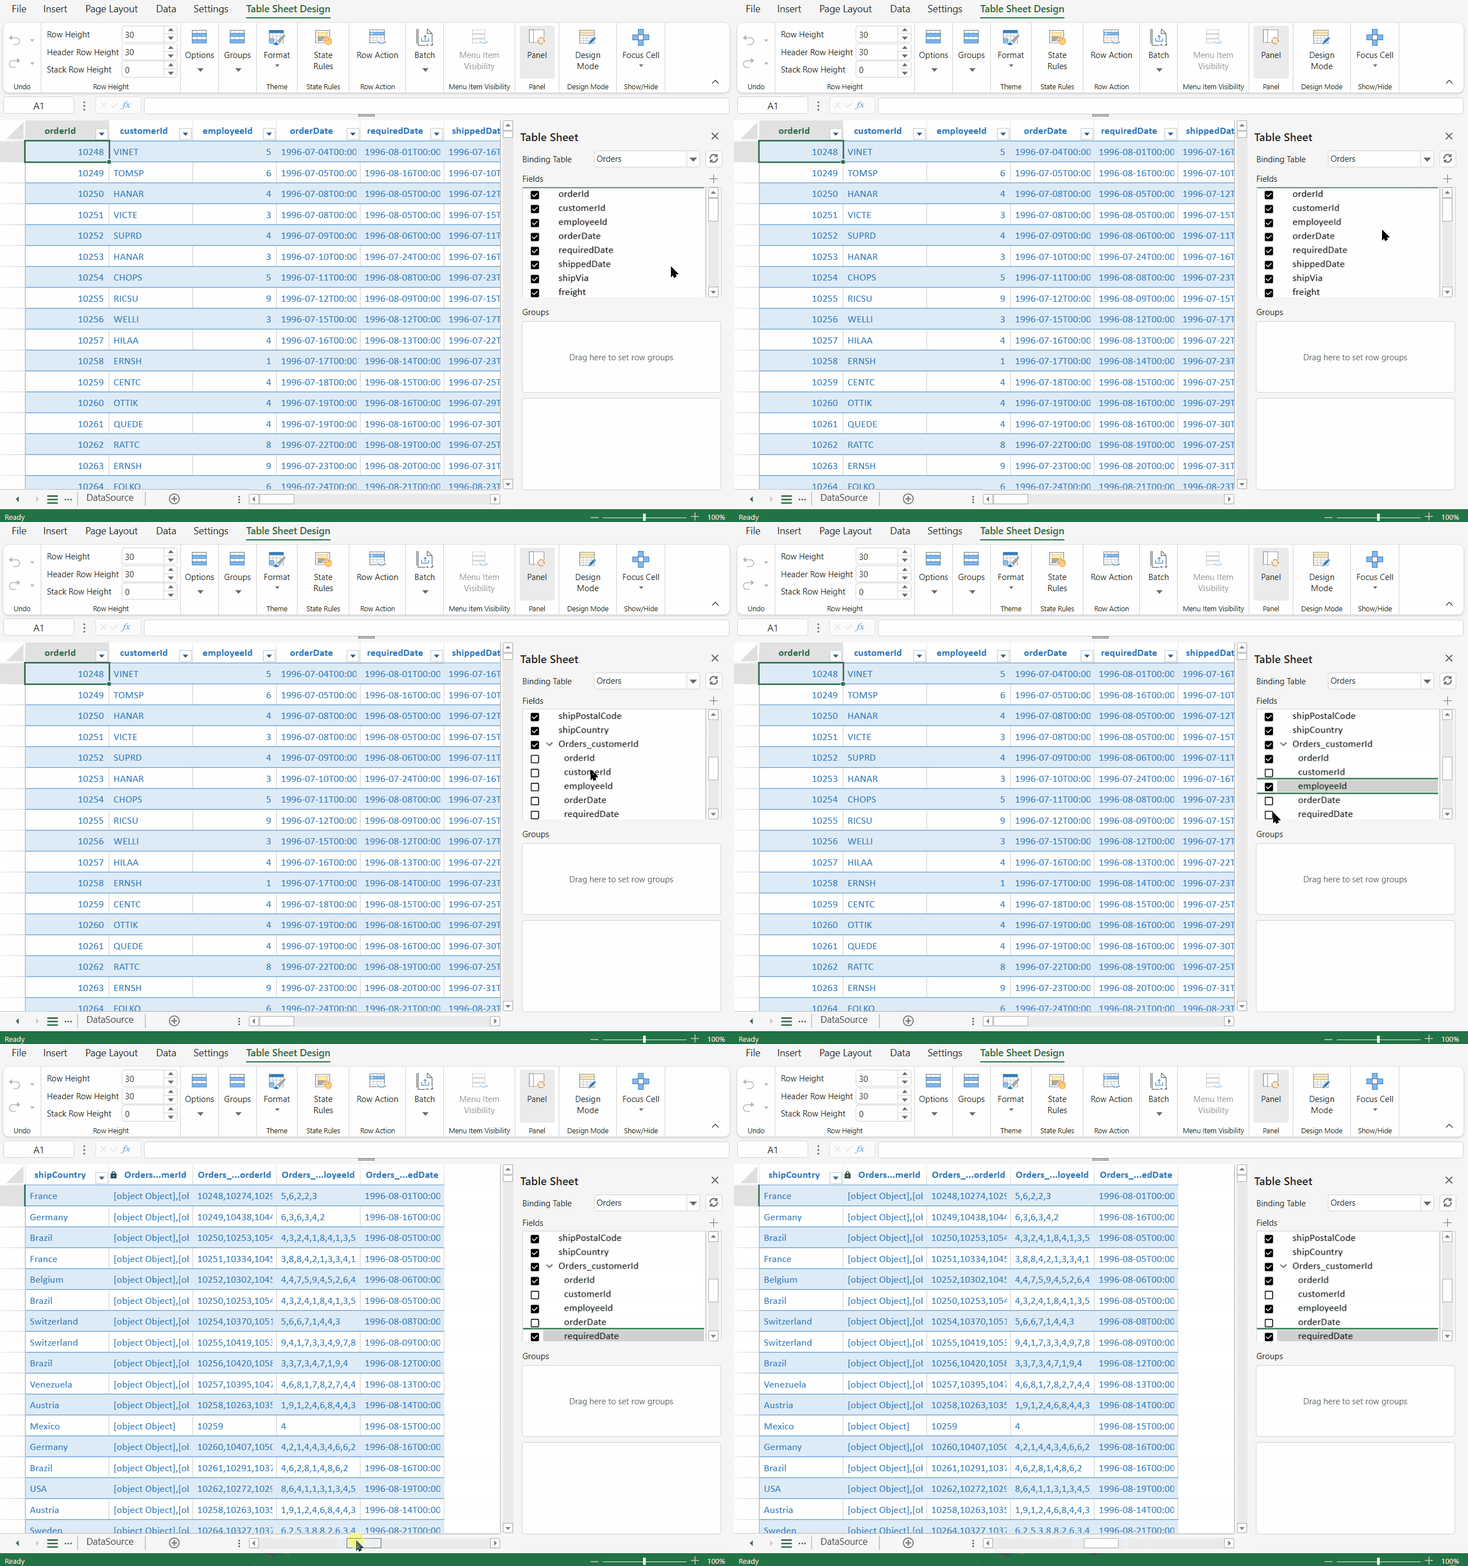
A tree structure is used in the side panel to better display the relationship between parent column relationship nodes. The check/uncheck buttons are also provided to check or uncheck the columns in the TableSheet. Selecting the main relationship column will add a column with the object in the TableSheet. If a relationship column is selected, the corresponding column will be added, and the child column names will indicate the hierarchical relationship through ".".
Drag and Drop Relationship Columns
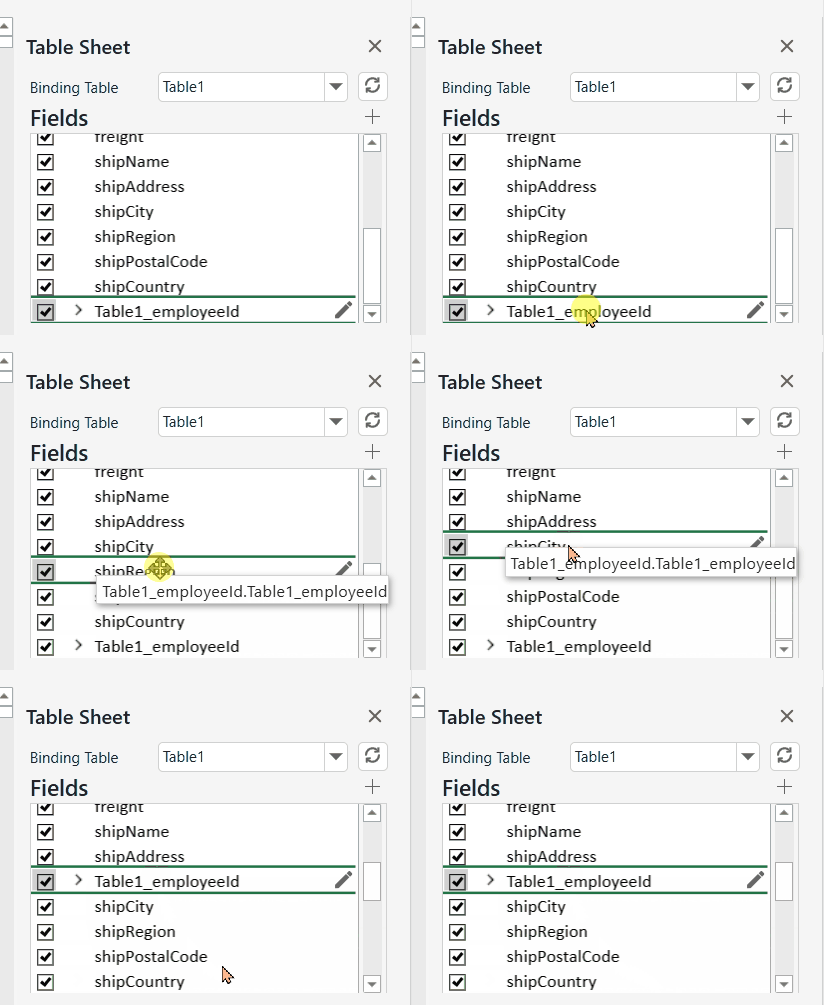
Users can drag and drop relationship nodes in the Binding Table Fields, and Groups area on the Table Sheet Designer side panel.
You can drag and drop relationship nodes on the side panel in the following ways:
Drag the relationship node within the Binding Table fields.
Drag the relationship to the Groups area.
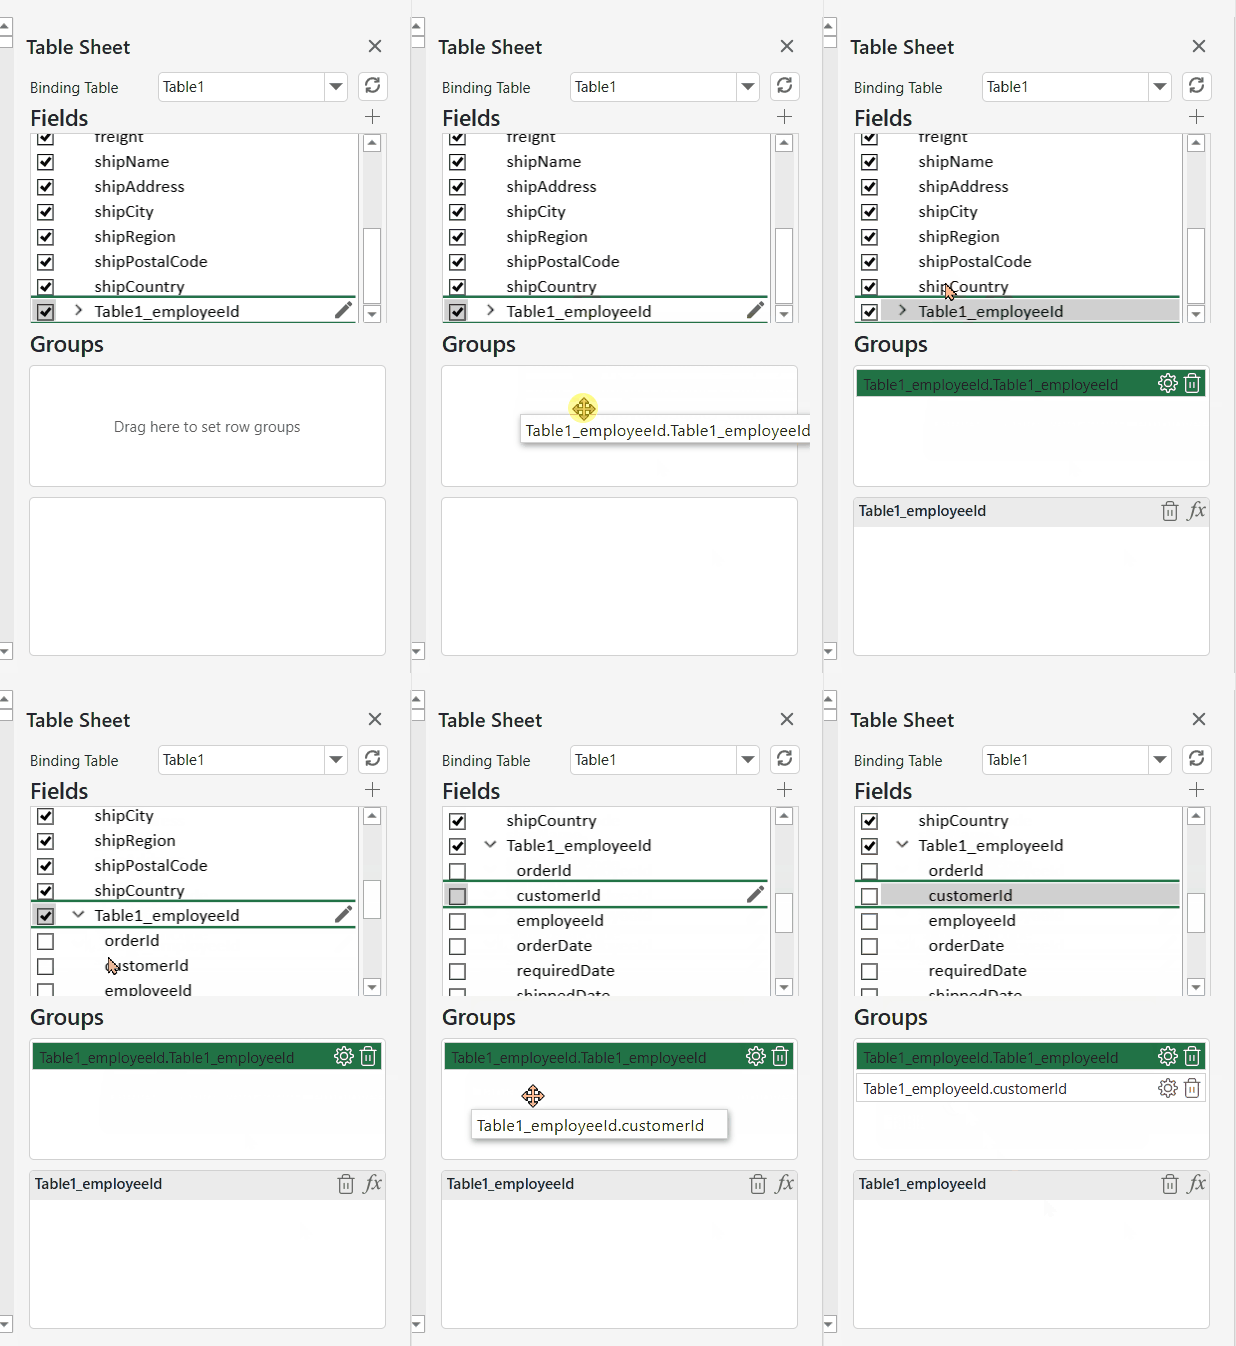
As observed, the drag tips use the value of the relationship to avoid duplicate names in the Group area.