- SpreadJS Overview
- Getting Started
- JavaScript Frameworks
- Best Practices
- Features
- SpreadJS Designer
- SpreadJS Designer VSCode Plugin
- Tutorials
-
SpreadJS Designer Component
- Getting Started
- Quick Start
- Theme
- Designer Interface
- JavaScript Frameworks
- Template-Based Workbook Initialization
- Customizations
-
Work in Designer Component
- AutoSum Functions
- Set Range Template Cell
- Name Box
- Select Cells Using Go To
- Find and Replace
- Edit Font Size
- Edit Font Family
- Manage Conditional Formatting Rules
- Shape Selection Pane
- Automatic Outline
- Format Painter
- Table Slicer
- Data Source
- TableSheet
- GanttSheet Designer
- ReportSheet Designer
- Data Chart Designer
- Text to Columns
- Remove Duplicates
- Pivot Table
- Dockable Side Panel
- Command Palette
- Transform Cells with LAMBDA Formula
- Threaded Comments Panel
- What-If Analysis
- Insert Function Dialog
- Named Cell Templates
- Insert Pictures in Designer
- Toolbar Ribbon
- API Documentation
- SpreadJS Collaboration Server
- Touch Support
- Formula Reference
- Import and Export Reference
- Events
- API Documentation
- Release Notes
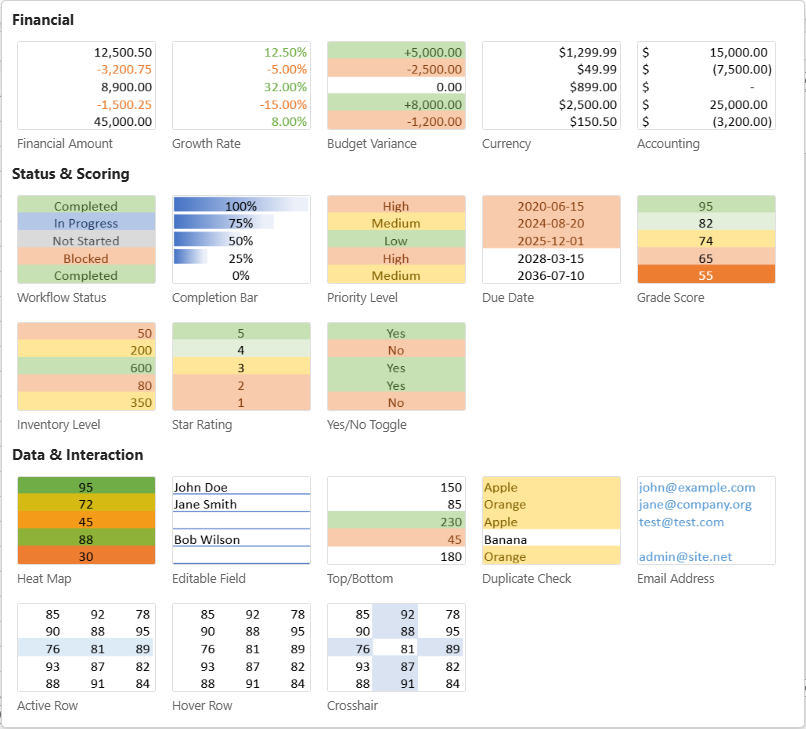
Built-in Named Cell Template Gallery
SpreadJS Designer includes a collection of built-in Named Cell Templates for common financial formatting, status tracking, data visualization, and interactive behaviors.
This page summarizes what each template configures when applied.
Templates are grouped into three categories:
Financial
Status & Scoring
Data & Interaction
Financial Templates
These templates provide standardized numeric formats commonly used in financial reporting and analysis.
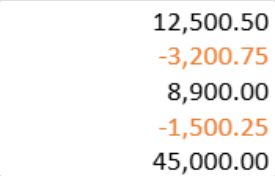
Financial Amount
Formats numeric values for general financial reporting.
Configuration
Number format:
#,##0.00Alignment: Right
Conditional formatting: Values below 0 displayed in red (Accent 2)
Data validation: Numeric values only
Effect
Applies thousand separators and two decimal places, and visually distinguishes negative amounts.
Growth Rate
Formats percentage-based metrics with visual differentiation for positive and negative values.
Configuration
Number format:
0.00%Alignment: Right
Conditional formatting:
Values greater than 0 → green font (Accent 6)
Values less than 0 → red font (Accent 2)
Effect
Standardizes percentage display and highlights increases and decreases.

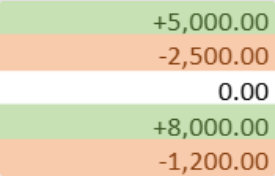
Budget Variance
Displays financial variances with clear visual indicators for favorable and unfavorable results.
Configuration
Number format:
+#,##0.00;-#,##0.00;0.00Alignment: Right
Conditional formatting:
Positive values → green background with dark green text
Negative values → red background with dark red text
Effect
Emphasizes variance direction using background color for easier comparison.
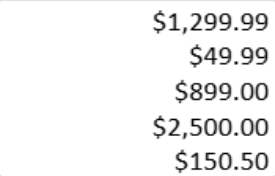
Currency
Applies U.S. dollar currency formatting.
Configuration
Number format:
$#,##0.00Alignment: Right
Effect
Displays values with a dollar symbol and thousand separators.
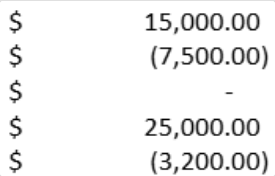
Accounting Format
Applies accounting-style number formatting for formal financial statements.
Configuration
Accounting number format with aligned currency symbol
Negative values displayed in parentheses
Alignment: Right
Effect
Ensures consistent accounting presentation and standardized negative value display.
Status & Scoring Templates
These templates support structured status management, scoring systems, and progress tracking.
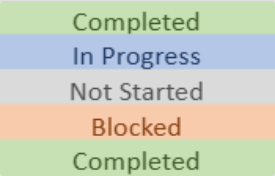
Workflow Status
Provides a standardized workflow selector with color-coded statuses.
Configuration
Alignment: Center
Data validation: Dropdown list (Not Started / In Progress / Completed / Blocked)
Conditional formatting:
Completed → green background
In Progress → blue background
Not Started → gray background
Blocked → red background
Effect
Ensures consistent status values while visually distinguishing workflow stages.
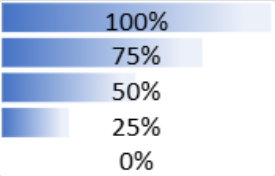
Completion Bar
Displays progress as a visual data bar.
Configuration
Number format: Percentage
Alignment: Center
Conditional formatting: Data bar (0–100% range)
Data validation: Decimal between 0 and 1
Effect
Represents completion percentage visually while preserving numeric values.
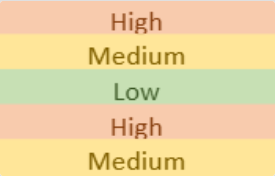
Priority Level
Provides a priority selector with color differentiation.
Configuration
Alignment: Center
Data validation: Dropdown list (High / Medium / Low)
Conditional formatting:
High → red background
Medium → yellow background
Low → green background
Effect
Standardizes priority levels and visually highlights urgency.
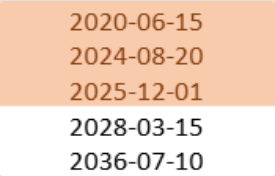
Due Date
Formats a cell as a date and highlights deadlines.
Configuration
Date format:
yyyy-mm-ddAlignment: Center
Data validation: Valid date range
Conditional formatting:
Overdue → red background
Due today → yellow background
Effect
Improves visibility of time-sensitive items and highlights approaching or missed deadlines.
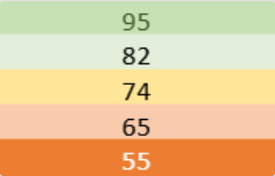
Grade Score
Applies score-based color grading.
Configuration
Alignment: Center
Data validation: Integer between 0 and 100
Conditional formatting:
90–100 → dark green
80–89 → light green
70–79 → yellow
60–69 → light red
Below 60 → dark red
Effect
Provides visual performance grading based on numeric score ranges.
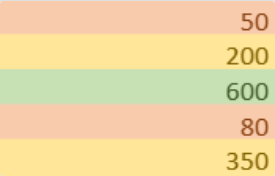
Inventory Level
Highlights stock levels using threshold-based coloring.
Configuration
Number format:
#,##0Alignment: Right
Data validation: Integer ≥ 0
Conditional formatting:
Below 100 → red (Low)
100–500 → yellow (Normal)
Above 500 → green (Sufficient)
Effect
Visually categorizes inventory quantities by level.
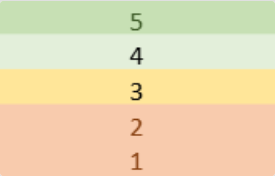
Star Rating
Displays a 1–5 rating scale with color indication.
Configuration
Alignment: Center
Data validation: Integer between 1 and 5
Conditional formatting:
5 → dark green
4 → light green
3 → yellow
1–2 → red
Effect
Standardizes rating input and visually differentiates score levels.
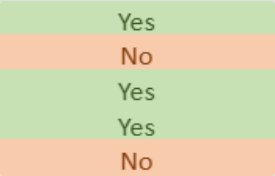
Yes/No Toggle
Provides a Boolean selector with color-coded values.
Configuration
Alignment: Center
Data validation: Dropdown list (Yes / No)
Conditional formatting:
Yes → green background
No → red background
Effect
Ensures consistent Boolean input with immediate visual feedback.
Data & Interaction Templates
These templates enhance data visualization and interactive behaviors.
Heat Map
Applies a three-color gradient based on relative cell values.
Configuration
Alignment: Center
Conditional formatting: Three-color scale
Lowest values → red (Accent 2)
Midpoint → yellow (Accent 4)
Highest values → green (Accent 6)
Effect
Highlights value distribution across a range using gradient coloring.
Editable Field
Creates an input-style cell with interactive visual feedback.
Configuration
Base style: White background with bottom border (Accent 5)
Cell states:
Hover → light blue background
Edit → blue background with full border
Active → Accent 1 border
Effect
Provides form-like interaction feedback for editable fields.
Top/Bottom
Highlights the top and bottom 10% of values within a range.
Configuration
Alignment: Right
Conditional formatting:
Top 10% → green background
Bottom 10% → red background
Effect
Quickly identifies extreme values in a dataset.
Duplicate Check
Highlights duplicate values within a range.
Configuration
Conditional formatting: Duplicate-value rule (yellow background with dark yellow text)
Effect
Helps detect repeated entries for data validation and cleanup.
Email Address
Formats a cell for email input and validates format.
Configuration
Alignment: Left
Font color: Accent 1 (blue)
Data validation: Email format validation rule with input guidance
Effect
Encourages correct email entry and visually distinguishes email fields.
Active Row
Highlights the entire row of the active cell.
Configuration
Conditional formatting: Row state rule (Active state)
Background color: Accent 1 (semi-transparent)
Effect
Improves row tracking in large datasets.
Hover Row
Highlights a row when the mouse hovers over it.
Configuration
Conditional formatting: Row state rule (Hover state)
Background color: Accent 5 (semi-transparent)
Effect
Enhances readability during data browsing.
Crosshair
Highlights both the row and column of the selected cell.
Configuration
Conditional formatting:
Row state rule (Selected state)
Column state rule (Selected state)
Cell state adjustment: Selected cell background set to transparent to avoid overlap
Effect
Provides precise positioning within matrix-style data.