- Document Solutions for PDF JS Overview
- Key Features
- Licensing and Redistribution
- Quick Start
- Memory Management
- Features
- Snippet Helpers
- Samples
- API Reference
- Release Notes
Work with Graphics
Graphics are visual elements that can be rendered as shapes, lines, curves, or paths on an image. In DsPdfJS, graphics are drawn using methods of the BmpContext class, which provides a drawing surface for a Bitmap.
The drawing API allows you to render a variety of graphic elements such as rectangles, polygons, ellipses, lines, and curves. These elements can be outlined using pens or filled using brushes such as solid colors, gradients, or hatch patterns.
The following graphic elements are supported:
Path
Line
Lines (a open set of connected lines)
Polygon (a closed set of connected lines)
Rectangle (including rounded rectangles)
Ellipse (including circles)
These elements can be combined to build more complex graphics and visual layouts.
Graphic Elements
DsPdfJS provides a set of drawing methods that allow you to render graphic elements on an image. These elements are drawn on a bitmap using the BmpContext class, which represents the drawing surface of a Bitmap.
Graphic elements can be simple shapes such as rectangles, ellipses, polygons, and lines, or more complex shapes composed of multiple curves and segments. Each element is rendered using the drawing methods provided by the BmpContext class, such as drawRect, drawEllipse, drawPolygon, and drawLine.
Shapes can be rendered with outlines using a Pen, and optionally filled using a brush. DsPdfJS supports several brush types for filling shapes, including:
SolidBrush
LinearGradientBrush
RadialGradientBrush
HatchBrush
ImageBrush
These brushes allow shapes to be filled with solid colors, gradients, patterns, or images, enabling the creation of complex graphics.
Add Graphic Element
You can add graphic elements to an image by drawing them on a Bitmap using its drawing context.
To add and fill a graphic element:
Create a Bitmap to serve as the drawing surface.
Get the drawing context using the bitmap’s context property.
Create a Pen to define the outline of the shape.
Optionally create a brush to fill the shape.
Draw the graphic element using a method such as drawRect, drawEllipse, or drawPolygon.
Save the resulting image.
Note: The examples on this page use helper functions from the Snippet Helpers module. These utilities are provided only to simplify the examples and are not part of the DsPdfJS API.
const origBmp = new Bitmap(500, 500, "White");
const ctx = origBmp.context;

const shapePen = new Pen({ color: "Black", width: 2 });
const solidBrush = new SolidBrush("LightPink");

ctx.drawRect(50, 50, 200, 125, {
    strokePen: shapePen,
    fillBrush: solidBrush
});

const center_Pent_X = 125;
const center_Pent_Y = 337;
const radius = 100;
const startAngle = -Math.PI / 2;
const pts = [];

for (let i = 0; i < 5; i++) {
    pts.push({
        x: Math.cos(Math.PI * 2 * i / 5 + startAngle) * radius + center_Pent_X,
        y: Math.sin(Math.PI * 2 * i / 5 + startAngle) * radius + center_Pent_Y
    });
}

const linearBrush = new LinearGradientBrush({ startColor: "Red", endColor: "Green" });

ctx.drawPolygon(pts, {
    strokePen: shapePen,
    fillBrush: linearBrush
});

const imgBytes = origBmp.saveAsPng();
Util.saveFile("fillShapes.png", imgBytes, "image/png");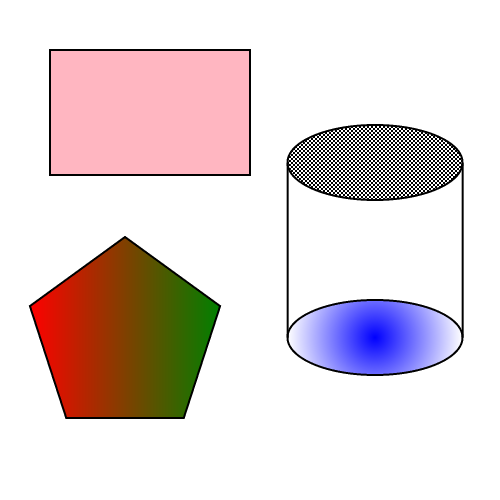
Draw and Fill Path
A graphics path is a sequence of connected lines and curves that form a single drawing object. In DsPdfJS, paths are created using the createPath method of the BmpContext class and rendered using the drawPath method.
The GraphicsPath object allows you to build complex shapes by combining segments such as lines, arcs, ellipses, and Bézier curves. Once defined, the path can be drawn with an outline and optionally filled with a color or brush.
To draw and fill a graphics path:
Create a Bitmap to serve as the drawing surface.
Get the drawing context from the bitmap.
Create a GraphicsPath using the createPath method.
Define the path geometry using methods such as addLine, addArc, or addEllipse.
Render the path using the drawPath method with stroke and fill options.
Save the resulting image.
const origBmp = new Bitmap(640, 530, "White");
const g = origBmp.context;

const shapePen = new Pen({ color: "Black", width: 2 });

const sz = { width: 500, height: 500 };
const path1 = createPath({ x: 0, y: 0, width: 500, height: 400 }, g, sz);

g.drawPath(path1, { strokePen: shapePen, fillColor: "Blue" });

g.translate(0, 50);
g.drawPath(path1, { strokePen: shapePen, fillColor: "Orange" });

g.translate(0, 50);
g.drawPath(path1, { strokePen: shapePen, fillColor: "Green" });

g.resetTransform();

const tf = new Format({
    font: Font.load(await Util.loadFile("fonts/times.ttf")),
    fontSize: 42
});

g.drawText("GRAPHICS", tf, 325, 95);
g.drawText("PATH", tf, 325, 155);

const imgBytes = origBmp.saveAsJpeg();
Util.saveFile("graphicPath.jpeg", imgBytes, "image/jpeg");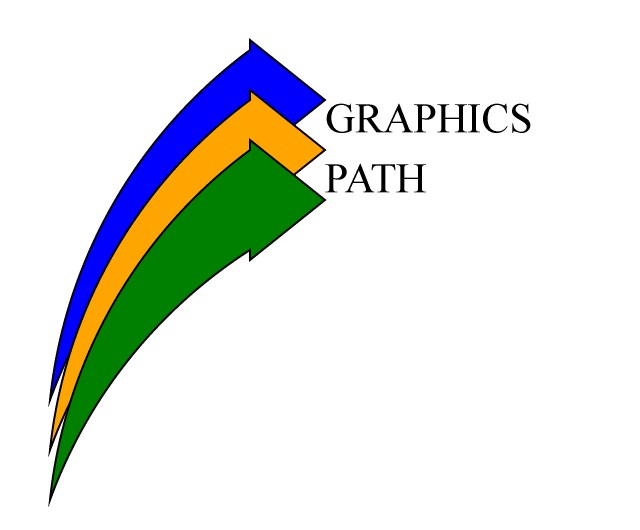
Antialiasing
Antialiasing improves the visual quality of graphics and text by smoothing jagged edges during rendering. In DsPdfJS, antialiasing behavior can be controlled using properties of the BmpContext class.
The following properties affect antialiasing behavior:
aliased – when set to true, graphic objects are drawn without antialiasing. This produces sharp pixel edges and provides the fastest rendering.
slowAntialiasing – when set to true, a higher‑quality antialiasing algorithm is used, producing better visual quality at the cost of rendering speed.
forceAntialiasingForText – when set to true, text is always drawn with antialiasing even if the aliased property is enabled.
These options allow you to balance rendering performance and visual quality depending on the scenario.
To render graphics using different antialiasing modes:
Create a Bitmap to serve as the drawing surface.
Get the drawing context using the bitmap’s context property.
Adjust the aliased or slowAntialiasing properties of the context.
Draw text or graphics using the selected settings.
Save the resulting image.
const bmp = new Bitmap(1000, 500, "White");
const ctx = bmp.context;

const tf = new Format({
    font: Font.load(await Util.loadFile("fonts/times.ttf")),
    fontSize: 32,
});
ctx.drawText("Different (anti)aliasing modes of rendering:", tf, 20, 40);

const bmp2 = new Bitmap(250, 90, "White");
const ctx2 = bmp2.context;

const tf2 = new Format({
    font: Font.load(await Util.loadFile("fonts/timesbi.ttf")),
    fontSize: 24,
});

ctx2.aliased = true;
ctx2.drawText("text with no antialiasing,", tf2, 5, 0);
ctx2.aliased = false;
ctx2.drawText("fast antialiasing,", tf2, 5, 30);
ctx2.slowAntialiasing = false;
ctx2.drawText("and slow antialiasing.", tf2, 5, 60);

ctx.drawImage(bmp2, 0, 100, bmp2.width * 4, bmp2.height * 4, { interpolationMode: InterpolationMode.NearestNeighbor });

//Save the image rendering different shapes
const imgBytes = bmp.saveAsJpeg();
Util.saveFile("antialiasing.jpeg", imgBytes, 'image/jpeg');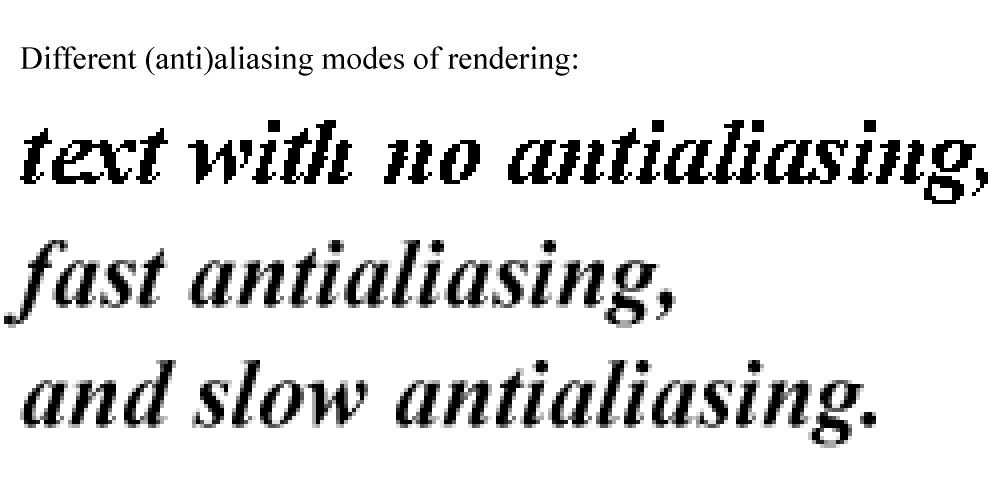
Clip Region
A clip region defines the area of an image where drawing operations are allowed. Any drawing performed outside the clip region is ignored. In DsPdfJS, a clip region can be applied using the pushClip method of the BmpContext class.
The clip region can be defined in several ways:
by specifying a rectangle using coordinates
by passing a rectangle bounds object
by providing a GraphicsPath
After a clip region is applied, all subsequent drawing operations are restricted to that region until it is removed using the popClip method.
To apply a clip region:
Load or create the image that will be used as the drawing surface.
Create a BmpContext for the bitmap.
Define the clipping area using either a rectangle or a GraphicsPath.
Apply the clip region using pushClip.
Perform drawing operations inside the clip region.
Call popClip to remove the clipping region.
const img = Image.load(await Util.loadFile("images/lavender.jpg"));
const w = img.width;
const h = img.height;
const ctx = new BmpContext(w, h, 0.5, "MistyRose");
const clipPath = ctx.createPath();
const rect = { x: 0, y: 0, width: w, height: h };
clipPath.addEllipse(rect);
ctx.pushClip(clipPath);
ctx.drawImage(img, rect);
ctx.popClip();
ctx.drawEllipse(w - 30, 10, 20, 20, { fillColor: "RoyalBlue" });

const imgBytes = ctx.bitmap.saveAsJpeg();
Util.saveFile("clipToEllipse.jpeg", imgBytes, 'image/jpeg');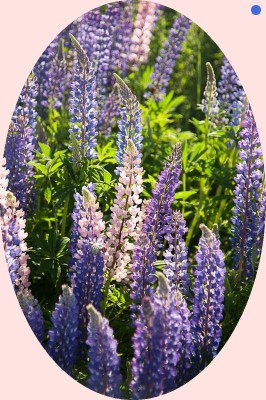
Align Image
DsPdfJS allows you to control how an image is positioned within a specified rectangle when drawing it. Image alignment is configured using the alignX and alignY options of the drawImage method. These options determine the horizontal and vertical placement of the image inside the target bounds.
Additional options such as keepAspectRatio and scaleToFill allow you to control how the image is resized relative to the container. For example, you can preserve the original aspect ratio of the image or scale it to completely fill the destination rectangle.
To align an image inside a container:
Create a BmpContext to serve as the drawing surface.
Load the image using the Image.load() method.
Define a rectangle that will act as the container for the image.
Call the drawImage method and specify alignment options such as alignX and alignY.
Optionally enable keepAspectRatio or scaleToFill to control image scaling.
Save the resulting image.
const ctx = new BmpContext(800, 900, 1, "White");

const image = Image.load(await Util.loadFile("images/lady.jpg"));
const font = Font.getPdfFont(StandardPdfFont.Helvetica);

ctx.scale(2);

ctx.drawText({ text: "Don't scale to fill", font, fontSize: 10 }, 60, 16);

const rect1 = { x: 50, y: 40, width: 100, height: 200 };
ctx.drawImage(image, rect1, {
    alignX: ImageAlignHorz.Center,
    alignY: ImageAlignVert.Center,
    keepAspectRatio: true
});
ctx.drawRect(rect1, { lineColor: "Red" });

ctx.drawText({ text: "Scale to fill", font, fontSize: 10 }, 255, 16);

const rect2 = { x: 230, y: 40, width: 100, height: 200 };
ctx.drawImage(image, rect2, {
    alignX: ImageAlignHorz.Center,
    alignY: ImageAlignVert.Center,
    scaleToFill: true,
    keepAspectRatio: true
});
ctx.drawRect(rect2, { lineColor: "Red" });

const rect3 = { x: 50, y: 300, width: 100, height: 100 };
ctx.drawImage(image, rect3, {
    alignX: ImageAlignHorz.Center,
    alignY: ImageAlignVert.Center,
    keepAspectRatio: true
});
ctx.drawRect(rect3, { lineColor: "Blue" });

const rect4 = { x: 230, y: 300, width: 100, height: 100 };
ctx.drawImage(image, rect4, {
    alignX: ImageAlignHorz.Center,
    alignY: ImageAlignVert.Center,
    scaleToFill: true,
    keepAspectRatio: true
});
ctx.drawRect(rect4, { lineColor: "Blue" });

const imgBytes = ctx.bitmap.saveAsJpeg();
Util.saveFile("alignImage.jpeg", imgBytes, "image/jpeg");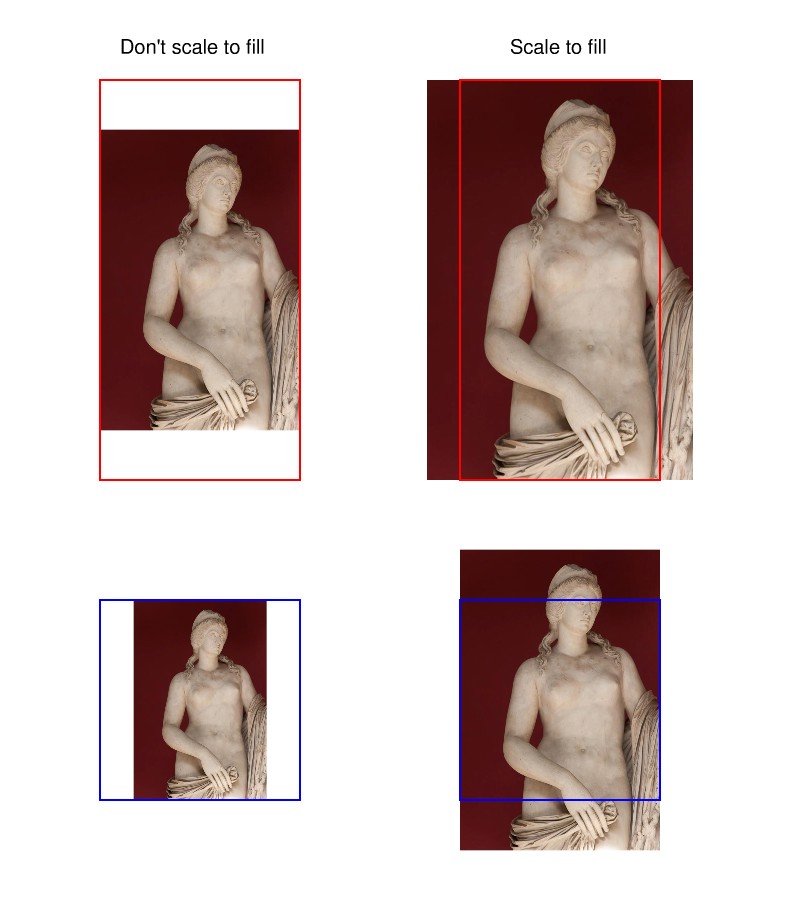
Apply Matrix Transformation
Transformations allow you to change the position, orientation, and scale of graphics before drawing them. In DsPdfJS, transformations are applied through methods of the BmpContext class such as translate, scale, rotate, and skew. These operations modify the current transformation matrix of the drawing context and affect all subsequent drawing operations.
Transformations are cumulative and are applied in the order they are invoked. You can reset the transformation matrix at any time using the resetTransform method.
To apply transformations to graphics:
Create a BmpContext to serve as the drawing surface.
Apply one or more transformation methods such as translate, scale, rotat, or skew.
Draw the graphic elements or text that should be affected by the transformation.
Optionally call resetTransform to return the drawing context to its default state.
Save the resulting image.
const inch = 96;
const fmt = new Format({
    font: Font.load(await Util.loadFile("fonts/FreeSerif.ttf")),
    fontSize: 18
});

const ctx = new BmpContext(1024, 1024, 1, "White");

const baseTxt = "Text drawn at (0,36) in a 4\"x2\" box";
const box = { x: 0, y: 36, width: inch * 4, height: inch * 2 };

// Box 1 – no transformation
drawBox(`Box 1: ${baseTxt}, no transformations.`, fmt, ctx, box);

ctx.translate(inch * 1, inch * 4);
ctx.scale(0.5);

// Box 2 – translated and scaled
drawBox(`Box 2: ${baseTxt}, translated by (1\",4\") and scaled by 0.5.`, fmt, ctx, box);

ctx.resetTransform();
ctx.scale(0.5);
ctx.translate(inch * 1, inch * 4);

// Box 3 – scaled then translated
drawBox(`Box 3: ${baseTxt}, scaled by 0.5 and translated by (1\",4\").`, fmt, ctx, box);

ctx.resetTransform();
ctx.scale(0.7);
ctx.translate(inch * 3, inch * 5);
ctx.rotate(-70, AngleUnits.Degrees);

// Box 4 – scaled, translated and rotated
drawBox(`Box 4: ${baseTxt}, scaled by 0.7, translated by (3\",5\"), and rotated 70 degrees counterclockwise.`, fmt, ctx, box);

ctx.translate(36, inch);

// Box 5 – additional translation
drawBox(`Box 5: ${baseTxt}, applied current transform (Box 4), and translated by (1/2\",1\").`, fmt, ctx, box);

ctx.resetTransform();
ctx.translate(inch * 3, inch * 6);
ctx.skew(-45, 20, AngleUnits.Degrees);

// Box 6 – skew transformation
drawBox(`Box 6: ${baseTxt}, translated by (3\",6\"), and skewed -45 degrees on axis X and 20 degrees on axis Y.`, fmt, ctx, box);

ctx.resetTransform();
ctx.translate(ctx.width - inch, ctx.height - inch);
ctx.rotate(180, AngleUnits.Degrees);

// Box 7 – rotation
drawBox(`Box 7: ${baseTxt}, translated by (7.5\",10\"), and rotated by 180 degrees.`, fmt, ctx, box);

ctx.resetTransform();
ctx.drawRect(2, 2, ctx.width - 4, ctx.height - 4, { lineColor: "DarkSlateBlue", lineWidth: 4 });

const imgBytes = ctx.bitmap.saveAsPng();
Util.saveFile("transformations.png", imgBytes, 'image/png');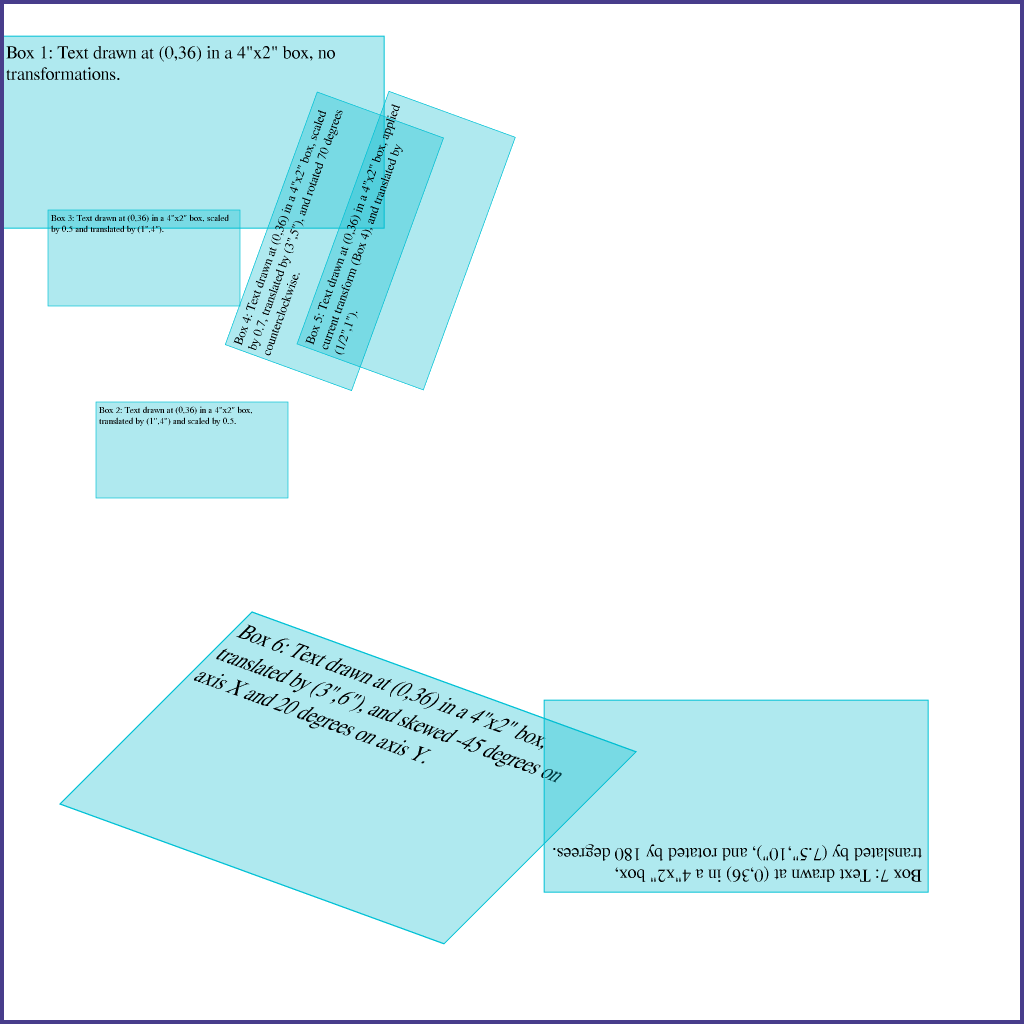
Add Transparency Layer
Transparency layers allow you to group multiple drawing operations and apply a uniform opacity to the entire group. In DsPdfJS, transparency layers are created using the pushLayer method of the BmpContext class.
When a transparency layer is pushed, all subsequent drawing operations are redirected to that layer until popLayer is called. When the layer is popped, its contents are composited onto the target surface using the specified opacity.
You can optionally define the content bounds of the layer to limit where drawing operations inside the layer can appear. If bounds are not specified, the layer uses the full drawing surface.
To add a transparency layer:
Create a BmpContext to serve as the drawing surface.
Draw any graphics that should appear below the transparency layer.
Call pushLayer(opacity, bounds) to create the transparency layer.
Perform the drawing operations that should be affected by the layer opacity.
Call popLayer to composite the layer back onto the drawing surface.
Save the resulting image.
const ctx = new BmpContext(250, 200, 3, "White");

const rect = { x: 50, y: 50, width: 150, height: 100 };

const hb = new HatchBrush({
    style: HatchStyle.ZigZag,
    backColor: "Yellow",
    foreColor: "Purple"
});

ctx.drawRect(rect, { fillBrush: hb, lineColor: "LightGreen", lineWidth: 6 });

const clipRect = { x: 70, y: 50, width: 110, height: 100 };

// create a transparency layer with opacity equal to 0.5
ctx.pushLayer(0.5, clipRect);

ctx.drawRect(rect, { fillColor: "Green" });

ctx.drawLayout({
    maxWidth: 150,
    textAlignment: TextAlignment.Center,
    lineSpacingScaleFactor: 0.8,
    runs: [{
        foreColor: "White",
        font: Font.getPdfFont(StandardPdfFont.Times),
        fontSize: 36,
        text: "Hello World!"
    }]
}, 50, 50);

// merge the transparency layer
ctx.popLayer();

const imgBytes = ctx.bitmap.saveAsPng();
Util.saveFile("transparencyLayer.png", imgBytes, 'image/png');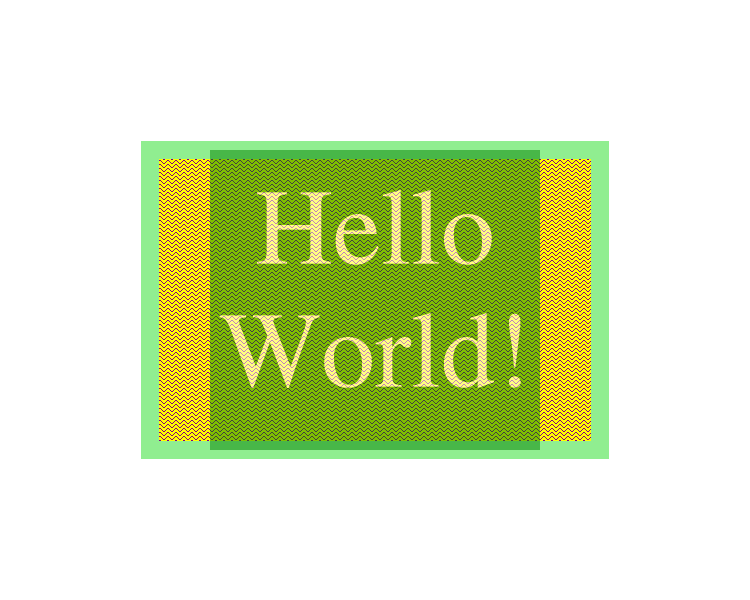
Interpolation Mode
Interpolation mode determines how pixel values are calculated when an image is resized or scaled. When an image is enlarged or reduced, new pixel values must be estimated from the surrounding pixels. Different interpolation modes use different algorithms to compute these values, affecting the quality and performance of the result.
DsPdfJS supports several interpolation modes through the InterpolationMode enumeration:
NearestNeighbor – uses the nearest pixel value and provides the fastest rendering, but with lower visual quality.
Linear – calculates pixel values using linear interpolation of neighboring pixels.
Cubic – produces smoother results by using cubic interpolation.
Downscale – optimized for reducing image size.
These modes can be specified when resizing an image using the resize method of the Bitmap class or when drawing images through drawing context operations.
The following code example demonstrates how to enlarge an image using different interpolation modes.
const bmp1 = Image.load(await Util.loadFile("images/qrcode-57x57.png")).toBitmap();
const bmp2 = bmp1.resize({ width: 350, height: 350, interpolationMode: InterpolationMode.NearestNeighbor });
const bmp3 = bmp1.resize({ width: 350, height: 350, interpolationMode: InterpolationMode.Linear });

const bmp = await Util.combineThreeImages(
    bmp1, "Original Image",
    bmp2, "NearestNeighbor Interpolation",
    bmp3, "Linear Interpolation"
);

const imgBytes = bmp.saveAsPng();
Util.saveFile("interpolationMode.png", imgBytes, 'image/png');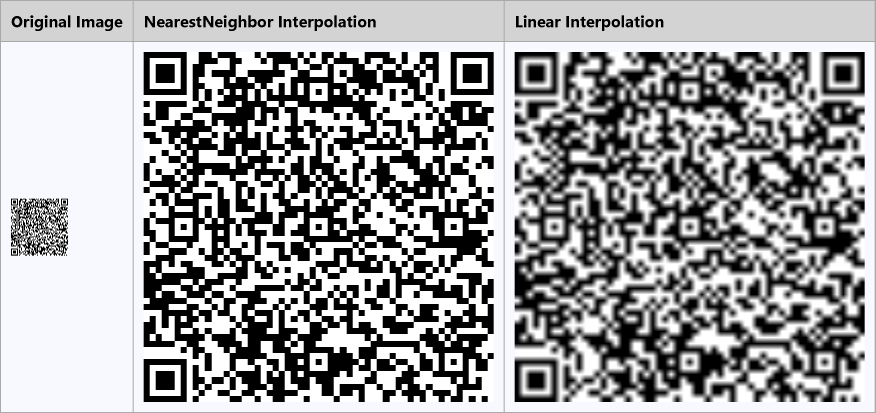
Add Shadow
Shadows can be used to create depth and visual emphasis in graphics. In DsPdfJS, you can generate a shadow for an image using the addShadow() method of the Bitmap class.
The addShadow method creates a new bitmap that contains the original image along with a shadow rendered from its transparent or semi‑transparent pixels. You can control the position, color, opacity, and blur radius of the shadow using the method parameters.
To add a shadow to an image:
Create a BmpContext to serve as the drawing surface.
Draw shapes, text, or other graphics onto the bitmap.
Call the addShadow method on the bitmap to generate a new image with a shadow.
Optionally convert the transparent background to an opaque color using convertToOpaque.
Save the resulting image.
const segoeFont = Font.load(await Util.loadFile("fonts/segoeui.ttf"));
const timesFont = Font.load(await Util.loadFile("fonts/times.ttf"));

const ctx = new BmpContext(800, 600, 1, "Transparent");
ctx.translate(0, -10);

// Draw figures.
ctx.drawEllipse(100, 100, 300, 200, { lineColor: "Orange", lineWidth: 20 });
ctx.drawLine(50, 400, 500, 50, { color: "RoyalBlue", width: 20, lineCap: PenLineCap.Round });

// Draw text.
const fmt = new Format({
    font: segoeFont,
    fontSize: 60,
    foreColor: "MistyRose",
    strokePen: new Pen({ color: "DarkRed" })
});
ctx.drawText("Howl's Moving Castle", fmt, 140, 150);

ctx.translate(50, 250);
ctx.rotate(30, AngleUnits.Degrees);
ctx.drawText("The quick brown fox jumps over the lazy dog.",
    new Format({
        font: timesFont,
        fontSize: 28,
        foreColor: "CornflowerBlue"
    }), 0, 0);

// Draw rectangle.
ctx.drawRect(-15, -10, 542, 50, { lineColor: "Salmon" });

// Add shadow.
const bmp2 = ctx.bitmap.addShadow(20, 50, "CadetBlue", 0.4);

// Convert transparent pixels to opaque.
bmp2.convertToOpaque("AliceBlue");

const imgBytes = bmp2.saveAsPng();
Util.saveFile("addShadow.png", imgBytes, 'image/png');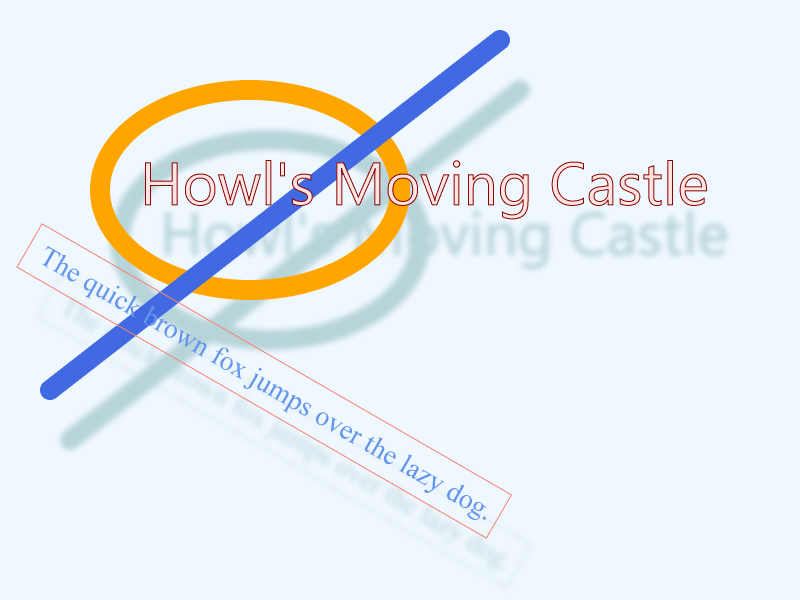
Apply Glow and Soft Edges
Glow and soft edge effects enhance graphics by modifying the boundaries of non‑transparent regions in an image. In DsPdfJS, these effects are applied using methods of the Bitmap class.
The glow effect expands the non‑transparent areas of an image and applies a blur, producing a glowing border around shapes or text. The soft edges effect shrinks the visible region and applies a blur to smooth the boundaries of the graphics.
To apply glow or soft edges to graphics:
Create a BmpContext and draw graphics or text on the bitmap.
Access the resulting bitmap using the bitmap property of the context.
Apply the desired effect using addGlow or applySoftEdges.
Optionally convert transparent pixels to an opaque background using convertToOpaque.
Display or save the resulting image.
The following example demonstrates applying a glow effect.
const calibriFont = Font.load(await Util.loadFile("fonts/calibri.ttf"));

const ctx = new BmpContext(800, 800, 1, "Transparent");
const fmt = new Format({
    font: calibriFont,
    fontSize: 170,
    foreColor: "SeaGreen",
    bold: true
});
const pen = new Pen({ color: "SeaGreen", width: 3 });

const tl = new Layout({
    maxWidth: ctx.width,
    maxHeight: ctx.height,
    lineSpacingScaleFactor: 0.8,
    paragraphAlignment: ParagraphAlignment.Center,
    textAlignment: TextAlignment.Center,
    marginBottom: 10
});

tl.appendLine({ text: "Document", format: fmt });
tl.append({
    text: "Solutions",
    format: fmt,
    strokePen: pen,
    foreColor: "White"
});

ctx.drawLayout(tl, 0, 0);

const bmp = ctx.bitmap.addGlow("Yellow", 0.8, 6, 12);
bmp.convertToOpaque("#997575");

Util.showBitmap(bmp);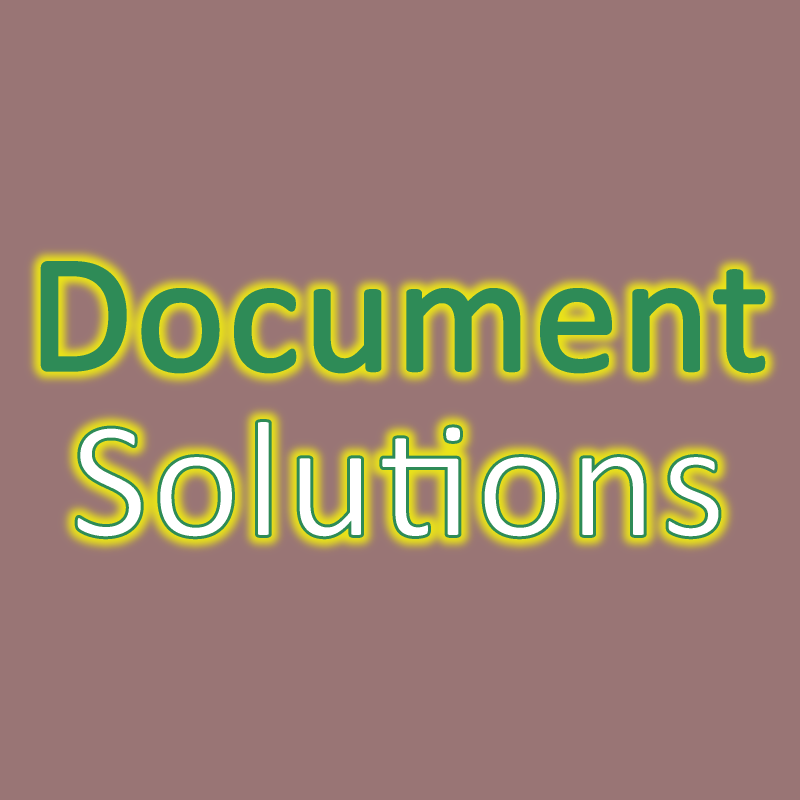
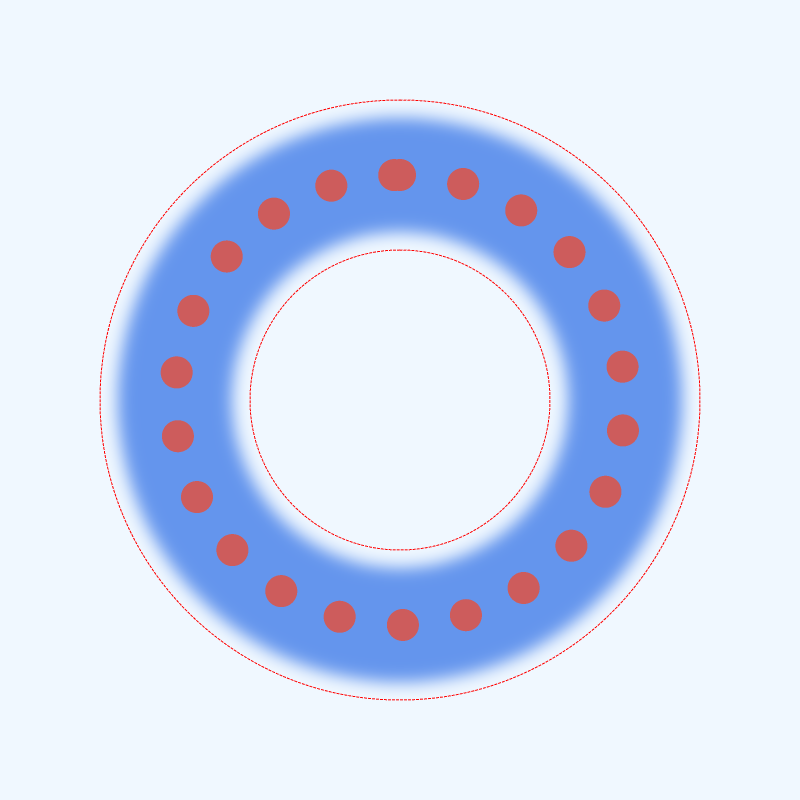
The following example demonstrates applying the soft edges effect.
const ctx = new BmpContext(800, 800, 1, "Transparent");

const path = ctx.createPath();
path.addEllipse({ x: 100, y: 100, width: 600, height: 600 });
path.addEllipse({ x: 250, y: 250, width: 300, height: 300 });
ctx.drawPath(path, { fillColor: "CornflowerBlue" });

ctx.drawEllipse(175, 175, 450, 450, {
    lineColor: "IndianRed",
    lineWidth: 32,
    lineStyle: DashStyle.Dot,
    lineCap: PenLineCap.Round
});

const bmp = ctx.bitmap;

bmp.applySoftEdges(-18, 24);
bmp.convertToOpaque("AliceBlue");

ctx.drawEllipse(100, 100, 600, 600, { lineColor: "Red", lineWidth: 1, lineStyle: DashStyle.Dash });
ctx.drawEllipse(250, 250, 300, 300, { lineColor: "Red", lineWidth: 1, lineStyle: DashStyle.Dash });

Util.showBitmap(bmp);