How to set fixed X, Y coordinates / manual node positioning in FlexDiagram (C1

Posted by: andrea.davoli on 1 September 2026, 12:28 pm EST

    • Post Options:
    • Link

    Posted 1 September 2026, 12:28 pm EST

    Hi ComponentOne Team,

    I am currently working with the C1.Win.Diagram assembly in a WinForms application (VB.NET) to generate a data flow diagram.

    I need to position nodes at specific custom X, Y coordinates to match a strict visual layout.

    However, I noticed that the Node class in C1.Diagram / C1.Win.Diagram does not seem to expose standard positional properties such as Location, Bounds, X/Y, or Geometry.

    Could you please clarify: Is there any way to assign fixed, absolute X and Y coordinates or manual bounds to individual Node objects in C1.Win.Diagram?

    Thank you in advance,

    David

  • Posted 2 September 2026, 1:18 am EST

    Hello,

    We investigated the requirement. Unfortunately, there is currently no way to specify or assign fixed, absolute X and Y coordinates to individual Node objects in C1.Win.Diagram. The positioning and layout of nodes are handled automatically by the control’s built-in layout engine.

    However, we are getting in touch with the development team to get their insights on this. We will let you know once we have more information from them.

    [Internal Tracking ID: C1WIN-35631]

    Best regards,

    Vivek Singh

  • Posted 2 September 2026, 5:15 am EST - Updated 2 September 2026, 5:20 am EST

    Thank you for the prompt response and clarification. I appreciate your assistance!

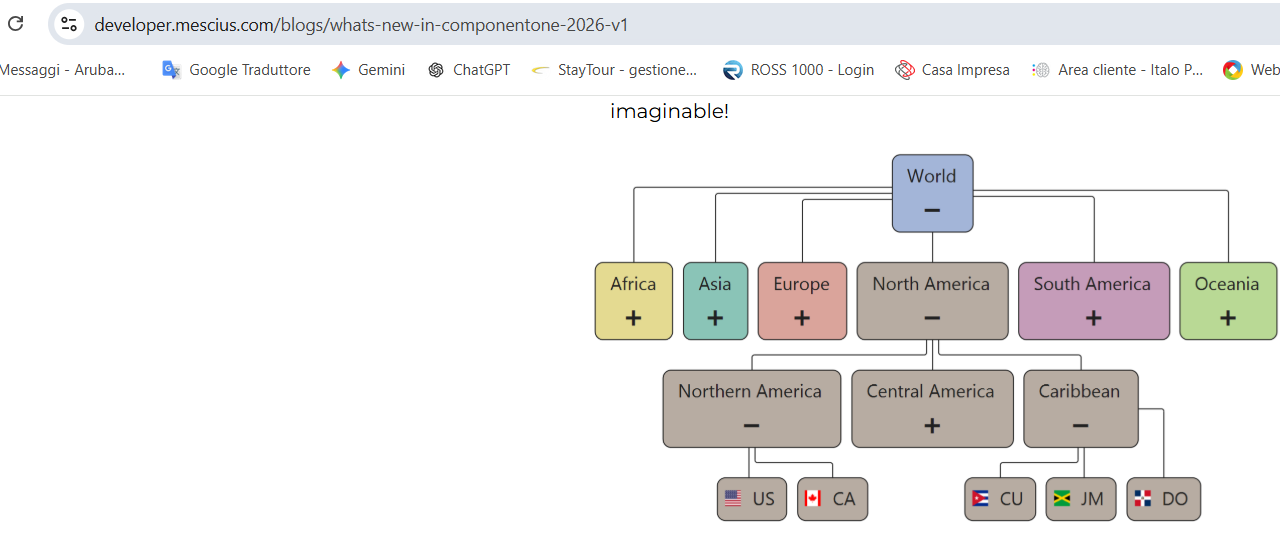
    I have a follow-up question regarding the layout organization. In your official documentation, the example diagrams appear perfectly structured with aligned rows, consistent node levels, and clean horizontal/vertical spacing.

    However, in my implementation, the layout places various nodes across inconsistent vertical levels and scattered positions, making the overall structure hard to read and digest.

    Is there a specific LayoutSettings or routing configuration (such as grid snapping, level alignment, or custom edge ordering) in FlexDiagram that forces nodes into neat, aligned rows and keeps connected branches structured like the examples in the documentation?

    Any code snippet or recommended settings to achieve a clean, level-aligned layout would be greatly appreciated.

  • Posted 3 September 2026, 2:35 am EST

    Hello,

    The development team have confirmed that at this moment there is no API that allows for custom node positioning. So, manual setting of X and Y coordinates for nodes is not currently possible.

    However, we have forwarded your layout concern to them to get their insights on this. We will update you as soon as we hear back from them

    Best regards,

    Vivek Singh

  • Posted 4 September 2026, 4:51 am EST

    Thank you very much

  • Posted 14 September 2026, 12:47 am EST

    Hello Andrea,

    Thank you for your patience while we discussed your concerns with the development team.

    Regarding your question about layout settings, the development team has confirmed that there are no such layout options currently available, though they may consider including them in a future release.

    The difference you observe between the product sample and your diagram is due to the structure of the data source. When the data structure is purely hierarchical, the layout remains structured in a clean tree structure. However, your data is graph-based, where nodes at different levels are interconnected, which creates an unstructured layout.

    In the meantime, the development team did some research and found a workaround to get a structured diagram (similar to the layout shown in the attached image) by using some hidden dummy nodes. If you find this structure useful for your case, please let us know, and we will provide you with the sample implementation to achieve this workaround.

    Best regards,

    Vivek Singh

    FlexDiagram_Layout_Customization.zip

  • Posted 14 September 2026, 9:19 am EST

    Hello Vivek,

    Thank you for following up with the development team’s feedback.

    We would indeed be very happy to see how to implement that structured diagram using the dummy nodes workaround. The layout shown in your attached image looks like a great approach for our graph-based data, so please go ahead and share the sample implementation with us.

    Thanks again for your support and assistance!

    Best regards

  • Posted 15 September 2026, 3:17 am EST

    Hello Andrea,

    We have attached the sample project with the workaround implementation. In the attached project, the AddTwoHiddenNodes() method adds two invisible nodes to keep the same number of levels for each branch.

    Please have a look at it and let us know if you have any further questions.

    Best regards,

    Vivek Singh

    flexdiagramRendering-HiddenNodes.zip

  • Posted 15 September 2026, 10:33 am EST

    Hello Vivek,

    Thank you for sending the sample project!

    We had actually considered using invisible dummy nodes as a workaround, but we weren’t sure it would work properly in a structure where multiple branches converge back into a single node. It’s great to know that this approach handles that scenario as well.

    We will test this implementation in our project and let you know if we run into any issues. Thanks again for your support!

    Best regards

Need extra support?

Upgrade your support plan and get personal unlimited phone support with our customer engagement team

Learn More

Forum Channels