
80+ Fast, Flexible, and Cross-Platform .NET MAUI Charts
Build dynamic dashboards and data visualizations with FlexChart, a cross-platform C# .NET MAUI chart control.
- Choose from 80+ popular chart types and configurations
- Combine different chart types bound to multiple data sources
- Supported for Android, iOS, and WinUI
Overview
.NET MAUI chart controls are UI libraries for creating and displaying 2D charts in desktop, web, or mobile applications. ComponentOne FlexChart provides bar, line, area, and many other chart types to help developers visualize data in meaningful ways.
Why Choose FlexChart for MAUI?
80+ Chart Types and Variations
Build the exact chart you need with FlexChart's many built-in .NET MAUI chart types, combination plots and stacking options.
Flexible Customization
Configure your C# .NET MAUI charts down to the smallest detail with label formatting, gridlines, tick marks, and more.
Cross-Platform Compatibility
Shorten your cross-platform migration using the same chart API across Blazor, WinUI and .NET MAUI, with added support for Android and iOS.
.NET MAUI Chart Types
Bar and Column Charts

Column Charts
Compare multiple data series over time in a horizontal bar or column chart. FlexChart supports displaying negative values below the axis origin.

Bar Stacked Charts
Stacked charts demonstrate the part-to-whole relationship for displaying the cumulative values of categories. Stack by value or percentage.

Floating Bar Charts
A floating bar or range column chart shows two values, a minimum and maximum, for each column or bar. The plot can be rotated to create a Gantt-style chart as well.
Line and Area Charts
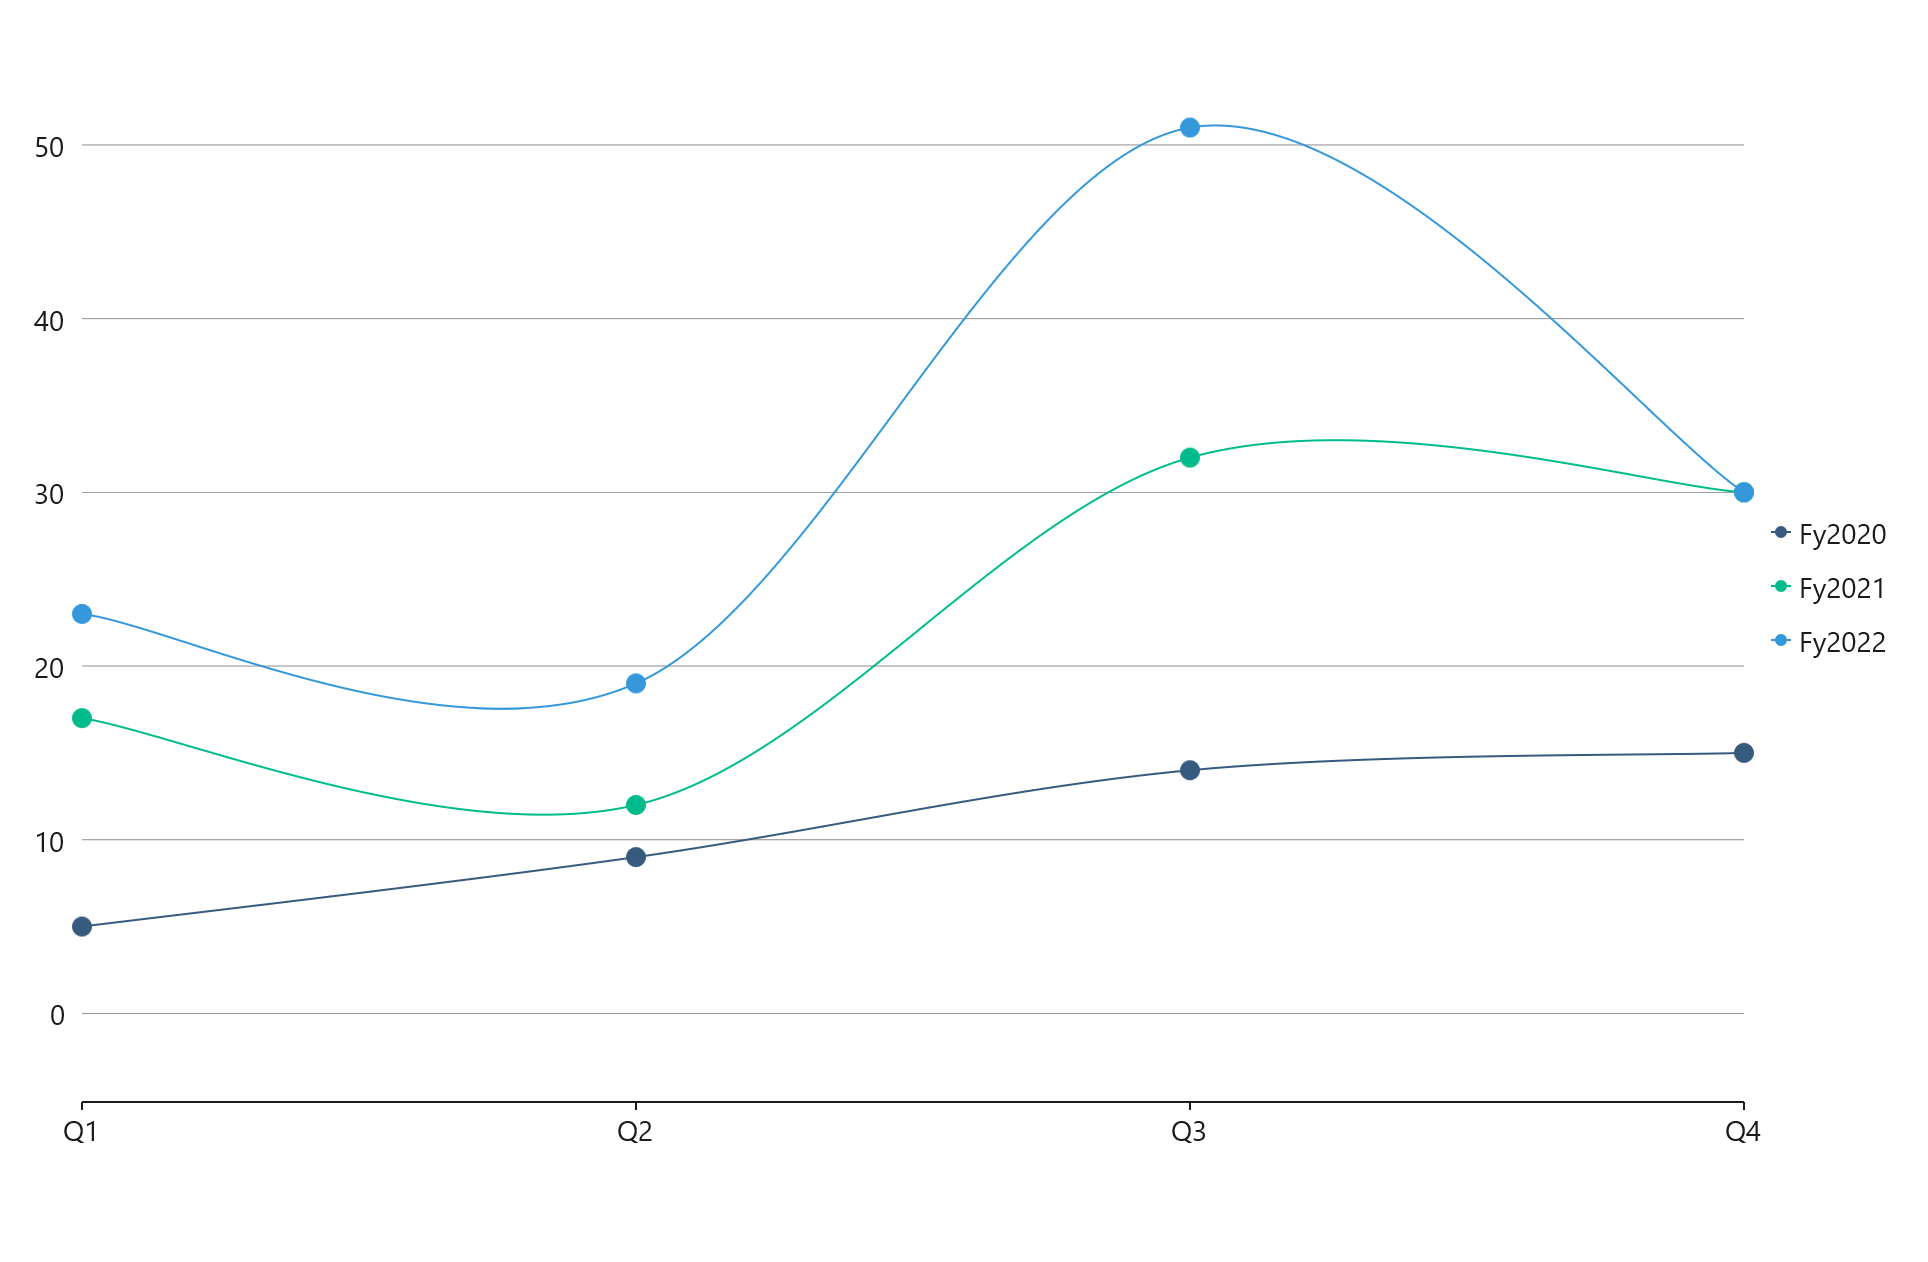
Line and Spline Charts
Display changes in data over short and long periods of time with a basic line chart with optional symbols. Line options include spline, symbol and stacking.

Area Charts
Fill in the area below the line to demonstrate trends in similar categories. WinUI area charts support stacking, spline and axis rotation.

Step Charts
Step line charts help visualize changes at a specific point. Data points are connected through vertical and horizontal lines. Display symbols or fill the area.
Scatter Charts

Scatter XY Charts
Demonstrate correlation between data points and a set of numerical data along the x-axis and the y-axis. .NET scatter charts combine values into single data points and display uneven intervals or clusters.

Bubble Charts
Create rich, visually appealing data modeling with bubble charts. This .NET MAUI chart allows you to display your data series as a set of differently-sized symbols using a third bound value in your dataset.
Pie and Sunburst Charts

Pie and Donut Charts
.NET MAUI pie charts show how parts of a whole add up to 100%. FlexPie features include inner radius (donut), exploded slices, animation, selection, and rotation.

Sunburst Charts
Visualize hierarchical data from a root node (center) outward to lower hierarchies. A segment of the inner circle is a parent to the segments of the outer circle which lie within the angular sweep of a parent.

Multiple Pie Charts
Use FlexPie to visualize more data in a single chart by creating multiple pie chart "series" using the same data source. An effective way of presenting data, especially if the intent is to show one section relative to the whole.
Radar and Polar Charts

Radar Charts
Display multivariate observations with an arbitrary number of variables. FlexRadar supports line, area, scatter and stacked chart types.

Radar Area Charts
Create a radar area chart using FlexRadar. This visualization lets you display changes in the radar through shaded regions with stacking support.

Polar Charts
Create circular graphs to display multivariate observations with an arbitrary number of variables. FlexRadar can generate polar charts with lines, columns, filled areas and custom symbols.
Heatmap and Contour Charts

Heatmap Charts
Create category and value-based discrete heatmaps with FlexChart. Heatmaps are like a 2D matrix that can help identify patterns, areas of concentration, and data variance.

Gradient Heatmaps
This specialized chart represents data values using colors and is especially useful in plotting large, complex data. Customize the discrete gradient color scale and gradient color axis.

2D Contour Charts
2D contour charts reveal insights that traditional plots simply can't show. FlexChart supports area and line contours, as well as built-in color scale support with a variety of sequential, diverging, and qualitative gradient color palettes.
Special MAUI Chart Types

Box-and-Whisker Charts
Graphically depict groups of numerical data through their quartile, mean, median and outliers. Optionally display inner points and outliers.

Error Bar Charts
Error bars help you see margins of error and standard deviations at a glance. They can be shown with any chart type as a standard error amount, a percentage, or a standard deviation.

Histogram Charts
Diagram consists of rectangles whose area is proportional to the frequency of a variable and whose width is equal to the class interval. Supports ranged axes, Gaussian/bell curve, running totals and Pareto charts.

Candlestick and HLOC Charts
The candlestick and HLOC (High-Low-Open-Close) chart types display stock or financial data for each day in the series.

Waterfall Charts
A waterfall chart helps understand the cumulative effect of sequentially introduced positive or negative values. Optionally, display auto-calculated intermediate totals in the waterfall chart.

Funnel Charts
Visualize stages of a process, such as a sales funnel, using a funnel shape. Supports triangular or rectangular shape.

BreakEven Charts
A break-even chart shows the sales volume level at which total costs equal sales. The chart plots revenue, fixed costs, and variable costs on the vertical axis, and volume on the horizontal axis.

TreeMap Charts
Highlight hierarchical, tree-structured data as a set of nested rectangles to help analyze the anomalies in the data set. Display the TreeMap as a horizontal or vertical stack of hierarchical rows - like a rectangular sunburst.

Horizontal TreeMap Charts
Horizontal and vertical treemaps represent tree-structured data as a set of flat rectangles of different sizes to help summarize the total values in the data set.
.NET MAUI Chart Key Features

Custom Color Palettes
Quickly choose one of FlexChart's 20 built-in color palettes, or customize your own palette with full opacity and gradient support.

Multiple Chart Types and Axes
Combine any Cartesian chart types into a single plot using FlexChart's flexible model. Each series can be set to a different chart type and Y axis allowing endless chart combinations.

Animation
Add animation when the mobile chart is loaded or when data points are updated. Choose an easing function and how to animate the data points.

Data Labels and Tooltips
Display precise chart values in labels attached to each data point. FlexChart can automatically display the formatted value or percentage within labels and tooltips. Prevent data labels from overlapping so all data is visible.

Trendlines
Add trend lines to show trends in data and make predictions. FlexChart supports several built-in regression and non-regression trendlines such as linear, average and polynomial.

Alarm Zones
Alarm Zones can be used to highlight important y-values in charts. This feature demonstrates FlexChart's rendering capabilities that allow you to draw custom elements in the plot area.
Axis Features

Staggered Axis Labels
Improve the readability of the axis labels through rotation or staggering. You can set the stagger level to any number of rows.

Axis Label Grouping
Visually group categorical or date based charts with axis label grouping. You can customize the separators to display vertically, horizontally or as a grid.

Logarithmic Axes
Logarithmic axes are ideal for visualizing data points that have a very broad gap between values. Each axis unit increases by a multiple rather than a linear increment.
Interactive Features
Pan and Zoom
Interact with the chart using device or touch gestures. Use pinch and stretch gestures on mobile or the mouse on desktop to zoom in and out.

Line Markers
Add interactive line markers or cross-hairs to show information about a specific point on your chart. Line markers can snap to data points or move when the user drags the line.

Selection and Hit-Test
Enable touch interactions with selection. Select data points or series to enable drill-down in your charts. Advanced hit-testing methods also help find the closest data point.


