How to Create a C# .NET Streamgraph with FlexChart
| Quick Start Guide | |
|---|---|
| What You Will Need |
Visual Studio 2022 ComponentOne WinForms Edition |
| Controls Referenced | |
| Tutorial Concept | Create a C# .NET streamgraph chart for analyzing stocks using ComponentOne FlexChart for WinForms. |
Imagine a peaceful stream flowing through time, where each ripple represents the behavior of distinct categories within the data. This is what a streamgraph does: it shows us how things change over time. Streamgraphs are useful for spotting trends and patterns in data, helping us understand how things evolve and make smarter decisions.
MESCIUS offers a ComponentOne charting component named FlexChart that provides enough flexibility to transform data to align our visualization preferences. We can use FlexChart to implement streamgraphs by modifying the stacked Spline Area Chart.
The following image shows what this transformation looks like:

In this blog, we are creating a streamgraph to analyze the sector-wise turnover insights of the stocks throughout a financial year. We have categorized the implementation process as follows:
- Set Up a .NET Application with the FlexChart Control
- Set Bindings to Create a Stacked Spline Area Chart
- Transform a Spline Area Chart into a Streamgraph
Ready to Get Started? Download ComponentOne Today!
Set Up a .NET Application with the FlexChart Control
Let's begin by setting up a new .NET 8 Windows Forms application that includes the ComponentOne FlexChart dependency by following the steps below. Note that you could also use FlexChart in a WPF, ASP.NET Core, WinUI, UWP, or .NET MAUI application. You can also get started with FlexChart by following along with the video below:
1. Open Visual Studio and select File | New | Project to create a new Windows Forms App.

2. Right-click on the project in Solution Explorer and choose Manage NuGet Packages…. from the context menu.

3. Search for the C1.Win.FlexChart package in the NuGet Package Manager and click on Install.

Now that we have installed the packages, let’s drag and drop the FlexChart control from the toolbox onto the form designer. The design of the form is shown below:

In this blog, we are using the “StockSecDB.mdb“ file to retrieve the stock data by establishing a connection as shown in the following code:
// method to create the datatable from the database
public DataTable CreateDataTable()
{
    DataTable stocksTable = new DataTable();
    string connectionString = "Provider=Microsoft.Ace.OLEDB.12.0;Data Source=" +
    System.IO.Path.Combine(Application.StartupPath,
    @"StockSecDB.mdb") + ";";
    OleDbConnection conn = new OleDbConnection(connectionString);
    OleDbDataAdapter adapter = new OleDbDataAdapter("Select * from Sector_wise_data", conn);
    adapter.Fill(stocksTable);
    return stocksTable;
}
Set Bindings to Create a Stacked Spline Area Chart
The spline area chart is a modified version of the area chart in which data points are connected by smooth curves. Stacking this chart layers up each series on top of the previous one, making them look more like the streamgraphs.
Let’s set the FlexChart type to “SplineArea” and implement the required bindings:
// method to implement bindings in the chart
public void SetupChart()
{
    // setting the chart type
    flexChart1.ChartType = ChartType.SplineArea;
    flexChart1.Stacking = Stacking.Stacked;

    // binding the flexchart
    flexChart1.DataSource = _stocksTable;
    flexChart1.BindingX = "Date";

    // adding series to the flexchart
    flexChart1.Series.Clear();
    flexChart1.Series.Add(new C1.Win.Chart.Series() { Binding = "DummySeries" });
    flexChart1.Series.Add(new C1.Win.Chart.Series() { Binding = "Automobile", Name = "Automobile" });
    flexChart1.Series.Add(new C1.Win.Chart.Series() { Binding = "Bank", Name = "Bank" });
    flexChart1.Series.Add(new C1.Win.Chart.Series() { Binding = "Energy", Name = "Energy" });
    flexChart1.Series.Add(new C1.Win.Chart.Series() { Binding = "IT", Name = "IT" });
    flexChart1.Series.Add(new C1.Win.Chart.Series() { Binding = "Oil and Gas", Name = "Oil and Gas" });
    flexChart1.Series.Add(new C1.Win.Chart.Series() { Binding = "Pharmacy", Name = "Pharmacy" });
}
After executing the above-given code, the chart appears as follows:
Note: For the demo project, we use Component built-in Themes with FlexChart to enhance the look.
Transform a Spline Area Chart into a Streamgraph
Now, it is time to convert the Spline Area chart we have just created into a Streamgraph. To do this, first, we need to consider the following features of the Streamgraph:
- The stream of the graph floats above the X-axis.
To visualize the floating effect, we need to place a transparent series between the X-axis and the actual data. This can be done by adding a dummy data series to the original data set. The basic idea is to use a large value based on our data and then subtract half of the total sum of all data values at that specific point. The following code demonstrates the implementation of this dummy data series:
// adding a dummy series to create a mid-way streamline effect
    // from other series
    _stocksTable.Columns.Add("DummySeries", typeof(decimal));
    Random rnd = new Random();
    foreach (DataRow row in _stocksTable.Rows)
    {
        decimal sum = 0;
        foreach (DataColumn column in _stocksTable.Columns)
        {
            if (columnNames.Contains(column.ColumnName))
            {
                sum += Convert.ToDecimal(row[column]);
            }
        }
        row["DummySeries"] = 25000 - sum / 2;
    }
Now that we have added the dummy data series, it is time to create the enclosed opening and closing of the stream flow. To generate this effect, let’s insert some dummy data points with zero values at the beginning and end of the dataset. This leaves gaps in the data for some X-axis values at the start and the end. This is achieved with the following code:
List<string> columnNames = new List<string>
{ "Automobile", "Bank", "Energy", "IT", "Oil and Gas", "Pharmacy" };
// adding some dummy points at the top of the datatable
// to create the starting flow effect of streamchart
DateTime firstDate = Convert.ToDateTime(_stocksTable.Rows[0]["Date"]);
for (int counter = -40; counter <= -15; counter++)
{
DataRow newRow = _stocksTable.NewRow();
newRow["Date"] = firstDate.AddDays(counter);
foreach (DataColumn column in _stocksTable.Columns)
{
if (column.ColumnName != "Date")
newRow[column.ColumnName] = 0; // Set zero value for other columns
}
_stocksTable.Rows.InsertAt(newRow, counter + 40);
}
// adding some dummy points at the bottom of the datatable
// to create the closing of stream flow effect
DateTime lastDate = Convert.ToDateTime(_stocksTable.Rows[_stocksTable.Rows.Count - 1]["Date"]);
for (int counter = 15; counter <= 40; counter++)
{
DataRow newRow = _stocksTable.NewRow();
newRow["Date"] = lastDate.AddDays(counter);
foreach (DataColumn column in _stocksTable.Columns)
{
if (column.ColumnName != "Date")
newRow[column.ColumnName] = 0; // Set zero value for other columns
}
_stocksTable.Rows.Add(newRow);
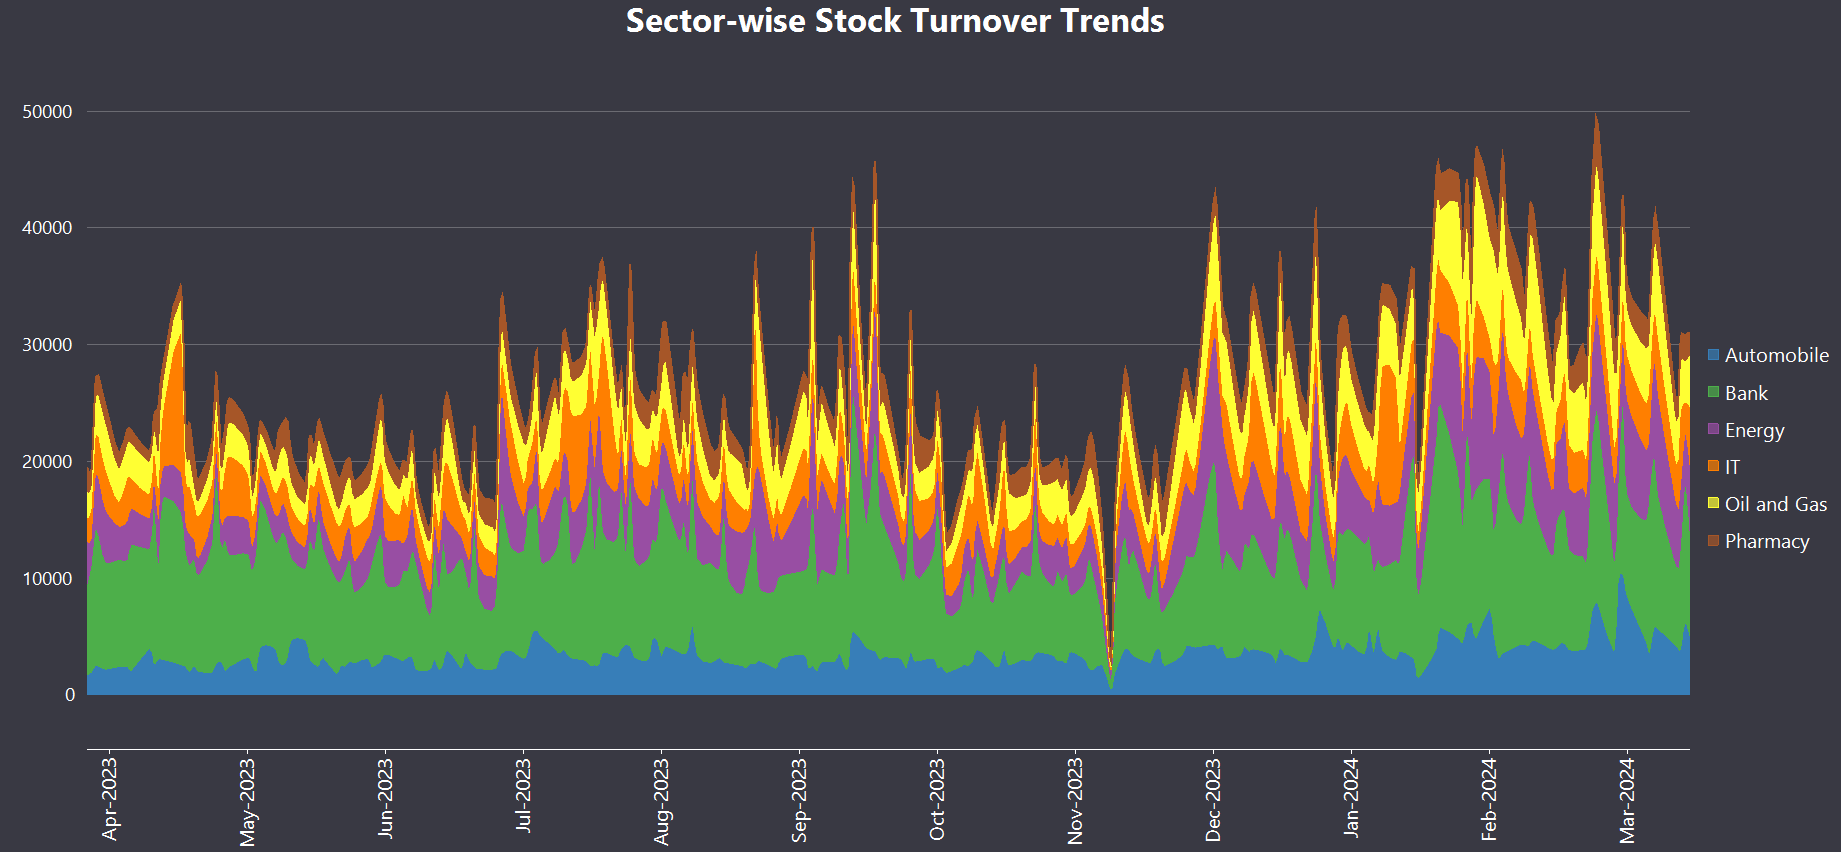
}Lastly, the appearance of the chart can be customized by adjusting various visual aspects, such as color palette, font, header content, legend, tooltip, and axis data display. This enhances the overall presentation of the chart.
// method to customize the appearance of the chart to show streamline effect
public void CustomizeChartAppearance()
{
    // assigning palette to the chart
    flexChart1.Palette = C1.Chart.Palette.Custom;
    flexChart1.CustomPalette = C1.Win.Chart.Palettes.Qualitative.Set1;
    flexChart1.Series[0].Style.FillColor = Color.Transparent; // setting transparent color to the dummy series

    // setting the axis, legend and header content
    flexChart1.AxisX.Style.Font = new Font("Segoe UI", 12, FontStyle.Regular);
    flexChart1.Header.Content = "Sector-wise Stock Analysis";
    flexChart1.Header.Style.Font = new Font("Segoe UI", 20, FontStyle.Bold);
    flexChart1.Legend.Style.Font = new Font("Segoe UI", 12, FontStyle.Regular);

    // setting the tooltip content
    flexChart1.ToolTip.Content = "{seriesName} \nDate: {Date:dd/MMM/yyyy}\nTurnover: INR {value} Cr";

    // modifying axis data display
    DateTime sampleDate = Convert.ToDateTime(_stocksTable.Rows[0]["Date"]);
    flexChart1.AxisX.MajorUnit = sampleDate.AddDays(31).ToOADate() - sampleDate.ToOADate();
    flexChart1.AxisX.Format = "MMM/yyyy";
    flexChart1.AxisX.LabelAngle = 90;

    // hiding Y-axis of the chart
    flexChart1.AxisY.Position = Position.None;
}
After performing all the above steps, the final chart appears as follows:

You can download the sample to follow along.
Conclusion
In this blog, we have explored the simple process of creating streamgraphs. Our FlexChart API offers a wide variety of charts that can be used to turn numbers into visuals. This helps to understand the information quickly and make decisions effectively.
Explore the FlexChart control more by referring to its official documentation.
Ready to check it out? Download ComponentOne Today!
If you have any inquiries, please leave them in the comments section below. Happy Coding!
Related Blogs
Try Our .NET UI Components & Datagrid
Getting Started With ComponentOne
